Perceptual Abundance
How we found the universe.
From Guessing to Seeing
For most of history, we looked at the stars and guessed.
The universe was always there. But we couldn’t see it clearly, or measure it precisely. So we guessed. Then, within a single lifetime, everything changed.
The universe became accessible.
This is our story.
I. Home
First, we saw our world from the outside.
In December 1968, Apollo 8 became the first crewed spacecraft to orbit the Moon. As it emerged from behind the far side, Bill Anders looked out the window and saw Earth rising above the barren lunar horizon.
He reached for his camera.
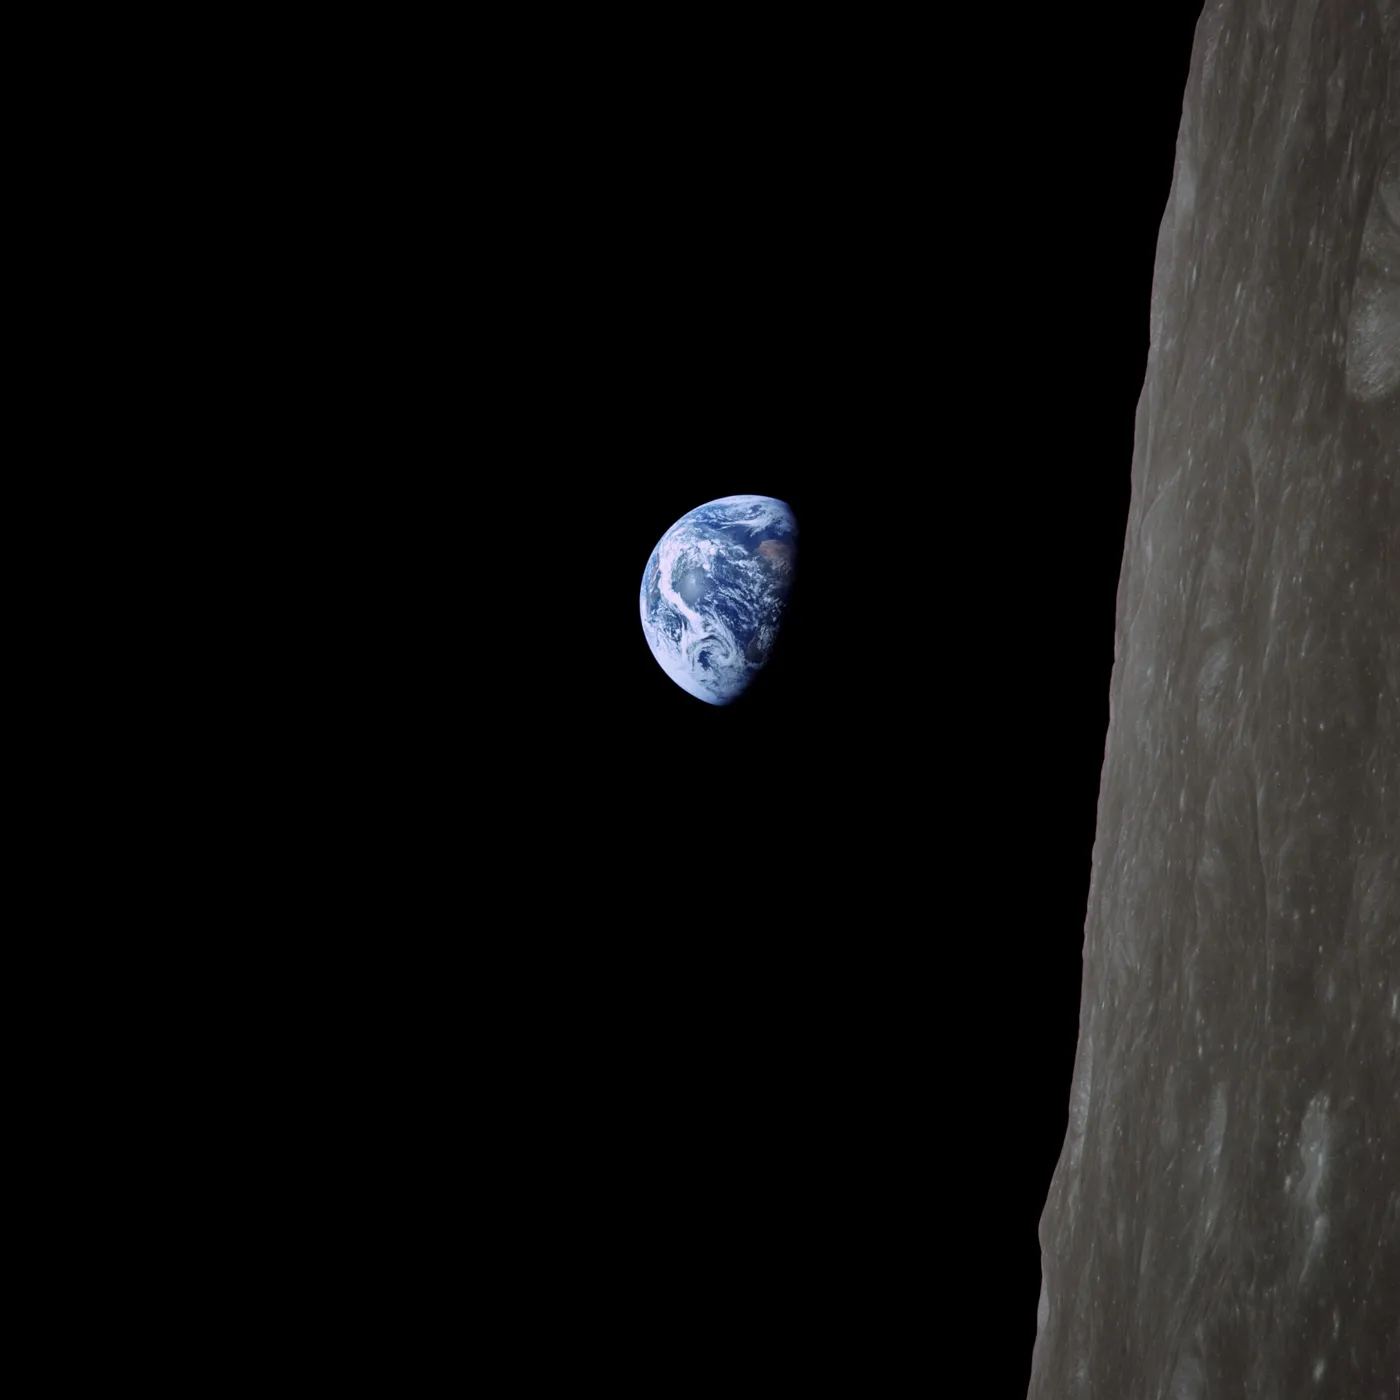
The photograph showed us home: fragile, isolated, suspended in darkness.
We could see our world.
II. Finding Other Worlds
Next, we found worlds beyond our own.
In 1995, Michel Mayor and Didier Queloz announced the discovery of the first planet orbiting a sun-like star outside our solar system. The news made headlines worldwide. Twenty-four years later, they won the Nobel Prize.
The catalogue grew to more than 6,000 confirmed exoplanets[1].
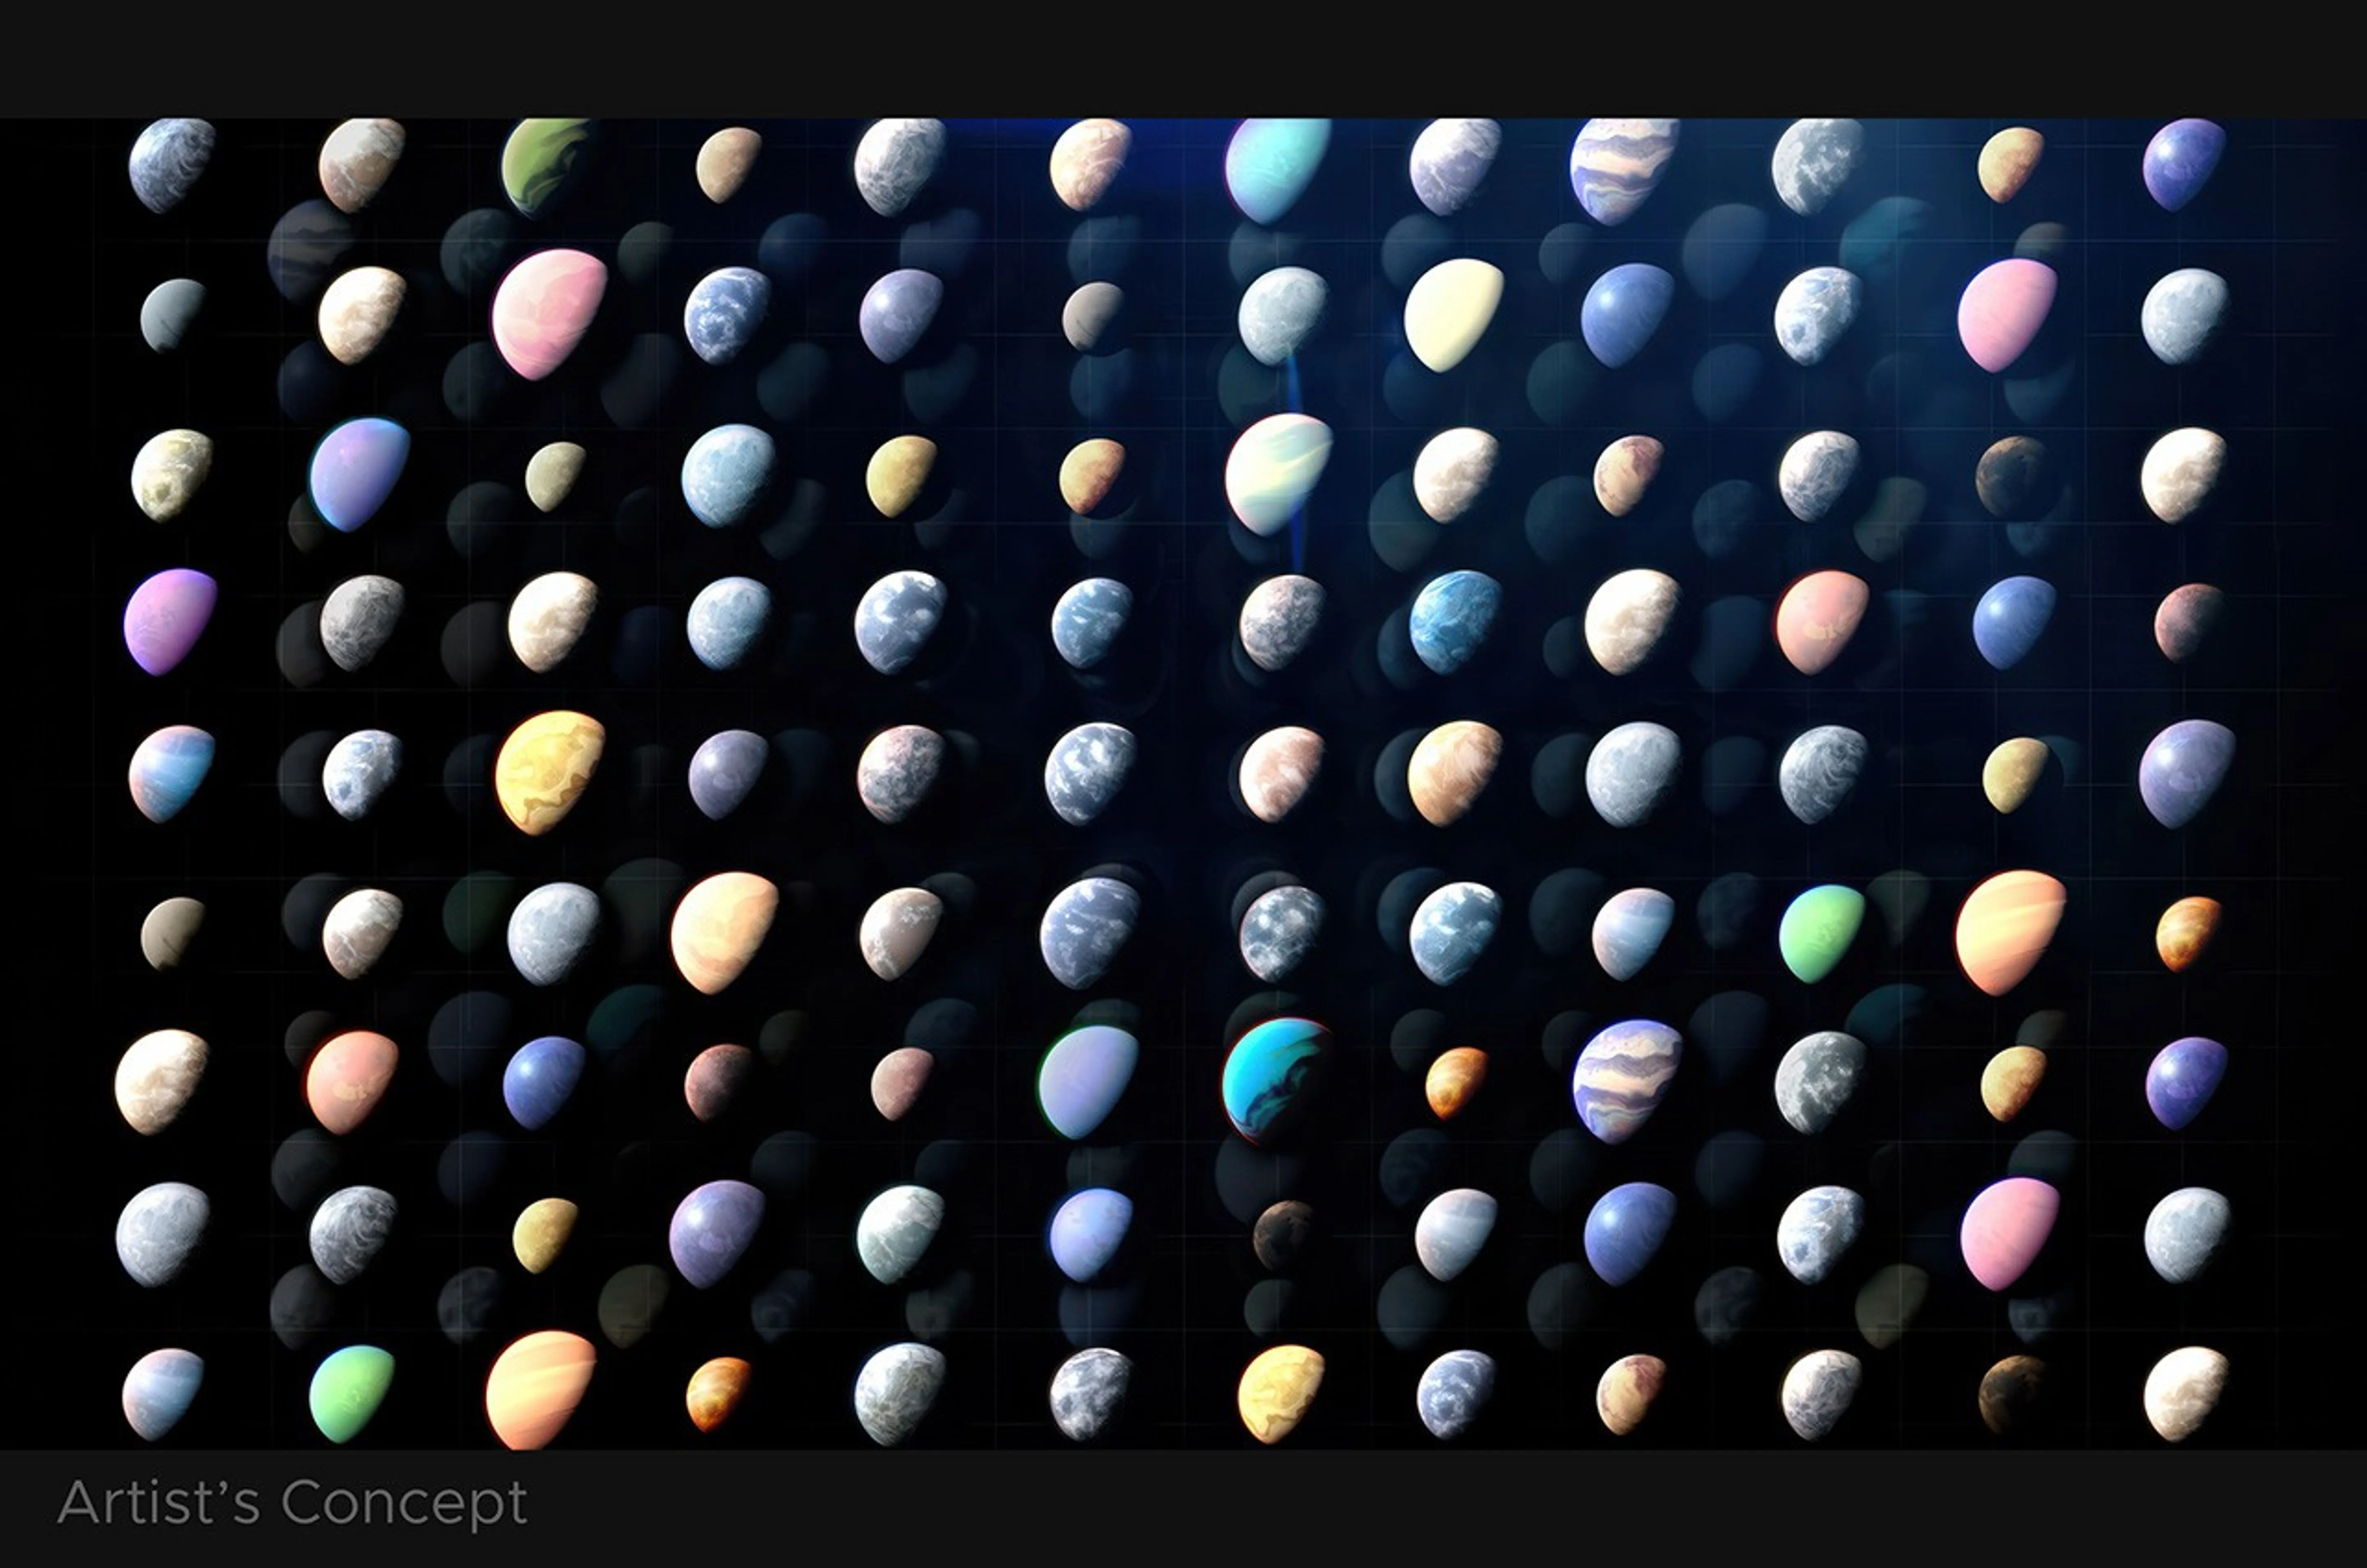
Astronomers read their atmospheres in starlight[2]. These worlds are dozens of light-years away, and we’re beginning to understand them.
After 1995, finding another world became background noise.
III. Feeling Spacetime
Then, we created a new sense we never had.
We can see light across a range of colours. We can feel vibrations through the air and in the ground. But evolution never gave us a sense for ripples in the fabric of spacetime.
On September 14, 2015, two instruments on opposite sides of the United States detected the same signal within milliseconds[3].
Two black holes, each dozens of times more massive than the Sun, had spiralled into each other 1.3 billion light-years away. In their final moments, they merged into a single, larger black hole. The collision rang out across the universe, with waves in spacetime flowing away at the speed of light.
When those gravitational waves passed through Earth, they stretched and squeezed space. The effect was infinitesimal—LIGO’s four-kilometre arms changed length by roughly one four-hundredth the width of a proton[4].
LIGO detected it.
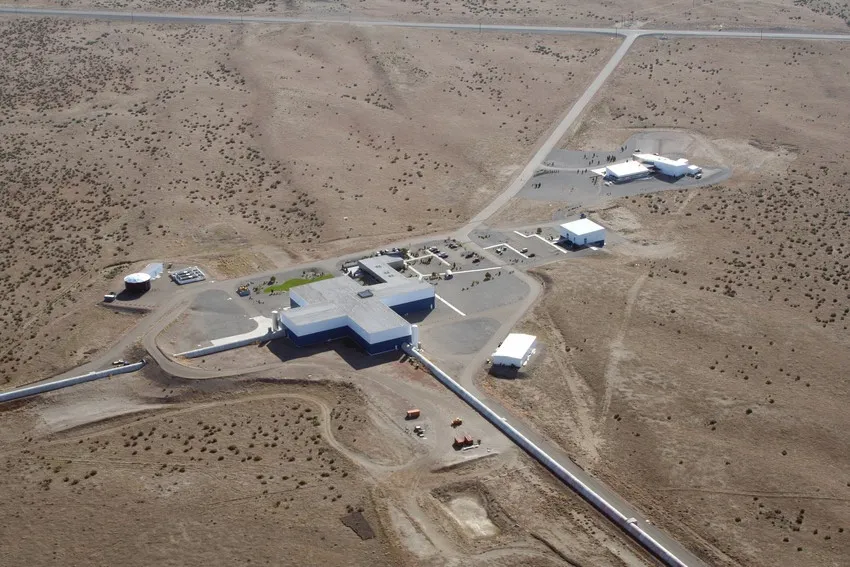
This was the first time we felt gravitational waves.
LIGO now detects these events routinely. Black hole mergers. Neutron star collisions. Some send us almost no light. Their gravity reaches us all the same.
Something evolution never gave us.
IV. Photographing the Unseeable
We even made absence visible.
The event horizon emits no light. By definition, nothing escapes. For decades, black holes were known only through their effects. Einstein’s equations predicted them. We saw their gravitational pull on nearby stars. We inferred they had to be there. But we had never actually seen one.
We made the Earth itself into a telescope.
Eight radio observatories scattered across the globe synchronised their observations down to the nanosecond[5]. Teams in Hawaii pointed their dishes at the same target as teams in Chile, Spain, and Mexico. They recorded petabytes of data. Months of computation joined the observations into one image.
In April 2019, the result reached the world: the first photograph of a black hole.
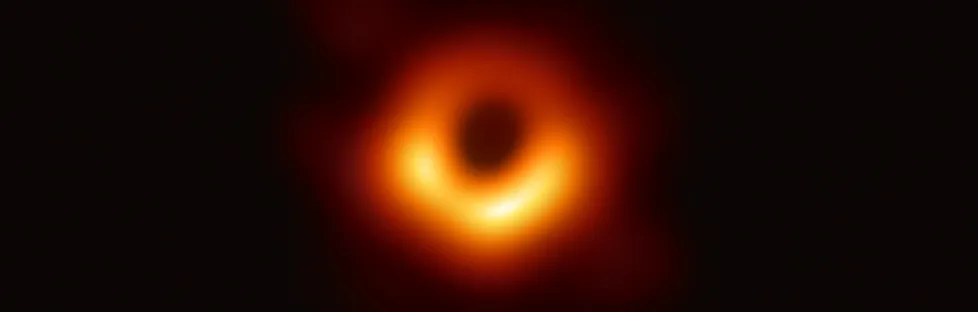
What you see is a ring of light from hot gas around the black hole. Against it lies a dark shadow, where the black hole captures light that would otherwise reach us. Its size agrees with the prediction of general relativity.
We photographed it.
V. Seeing the Beginning
We learned to look back in time.
The James Webb Space Telescope, launched in 2021, carries a mirror six and a half metres across, unfolded in space. Its instruments observe in the cold behind a vast sunshield.
In July 2022, its first deep field image reached the world[6].
Hold a grain of sand at arm’s length. That is how much of the sky fits in this image. Webb gathered its light across several wavelengths, over 12.5 hours.
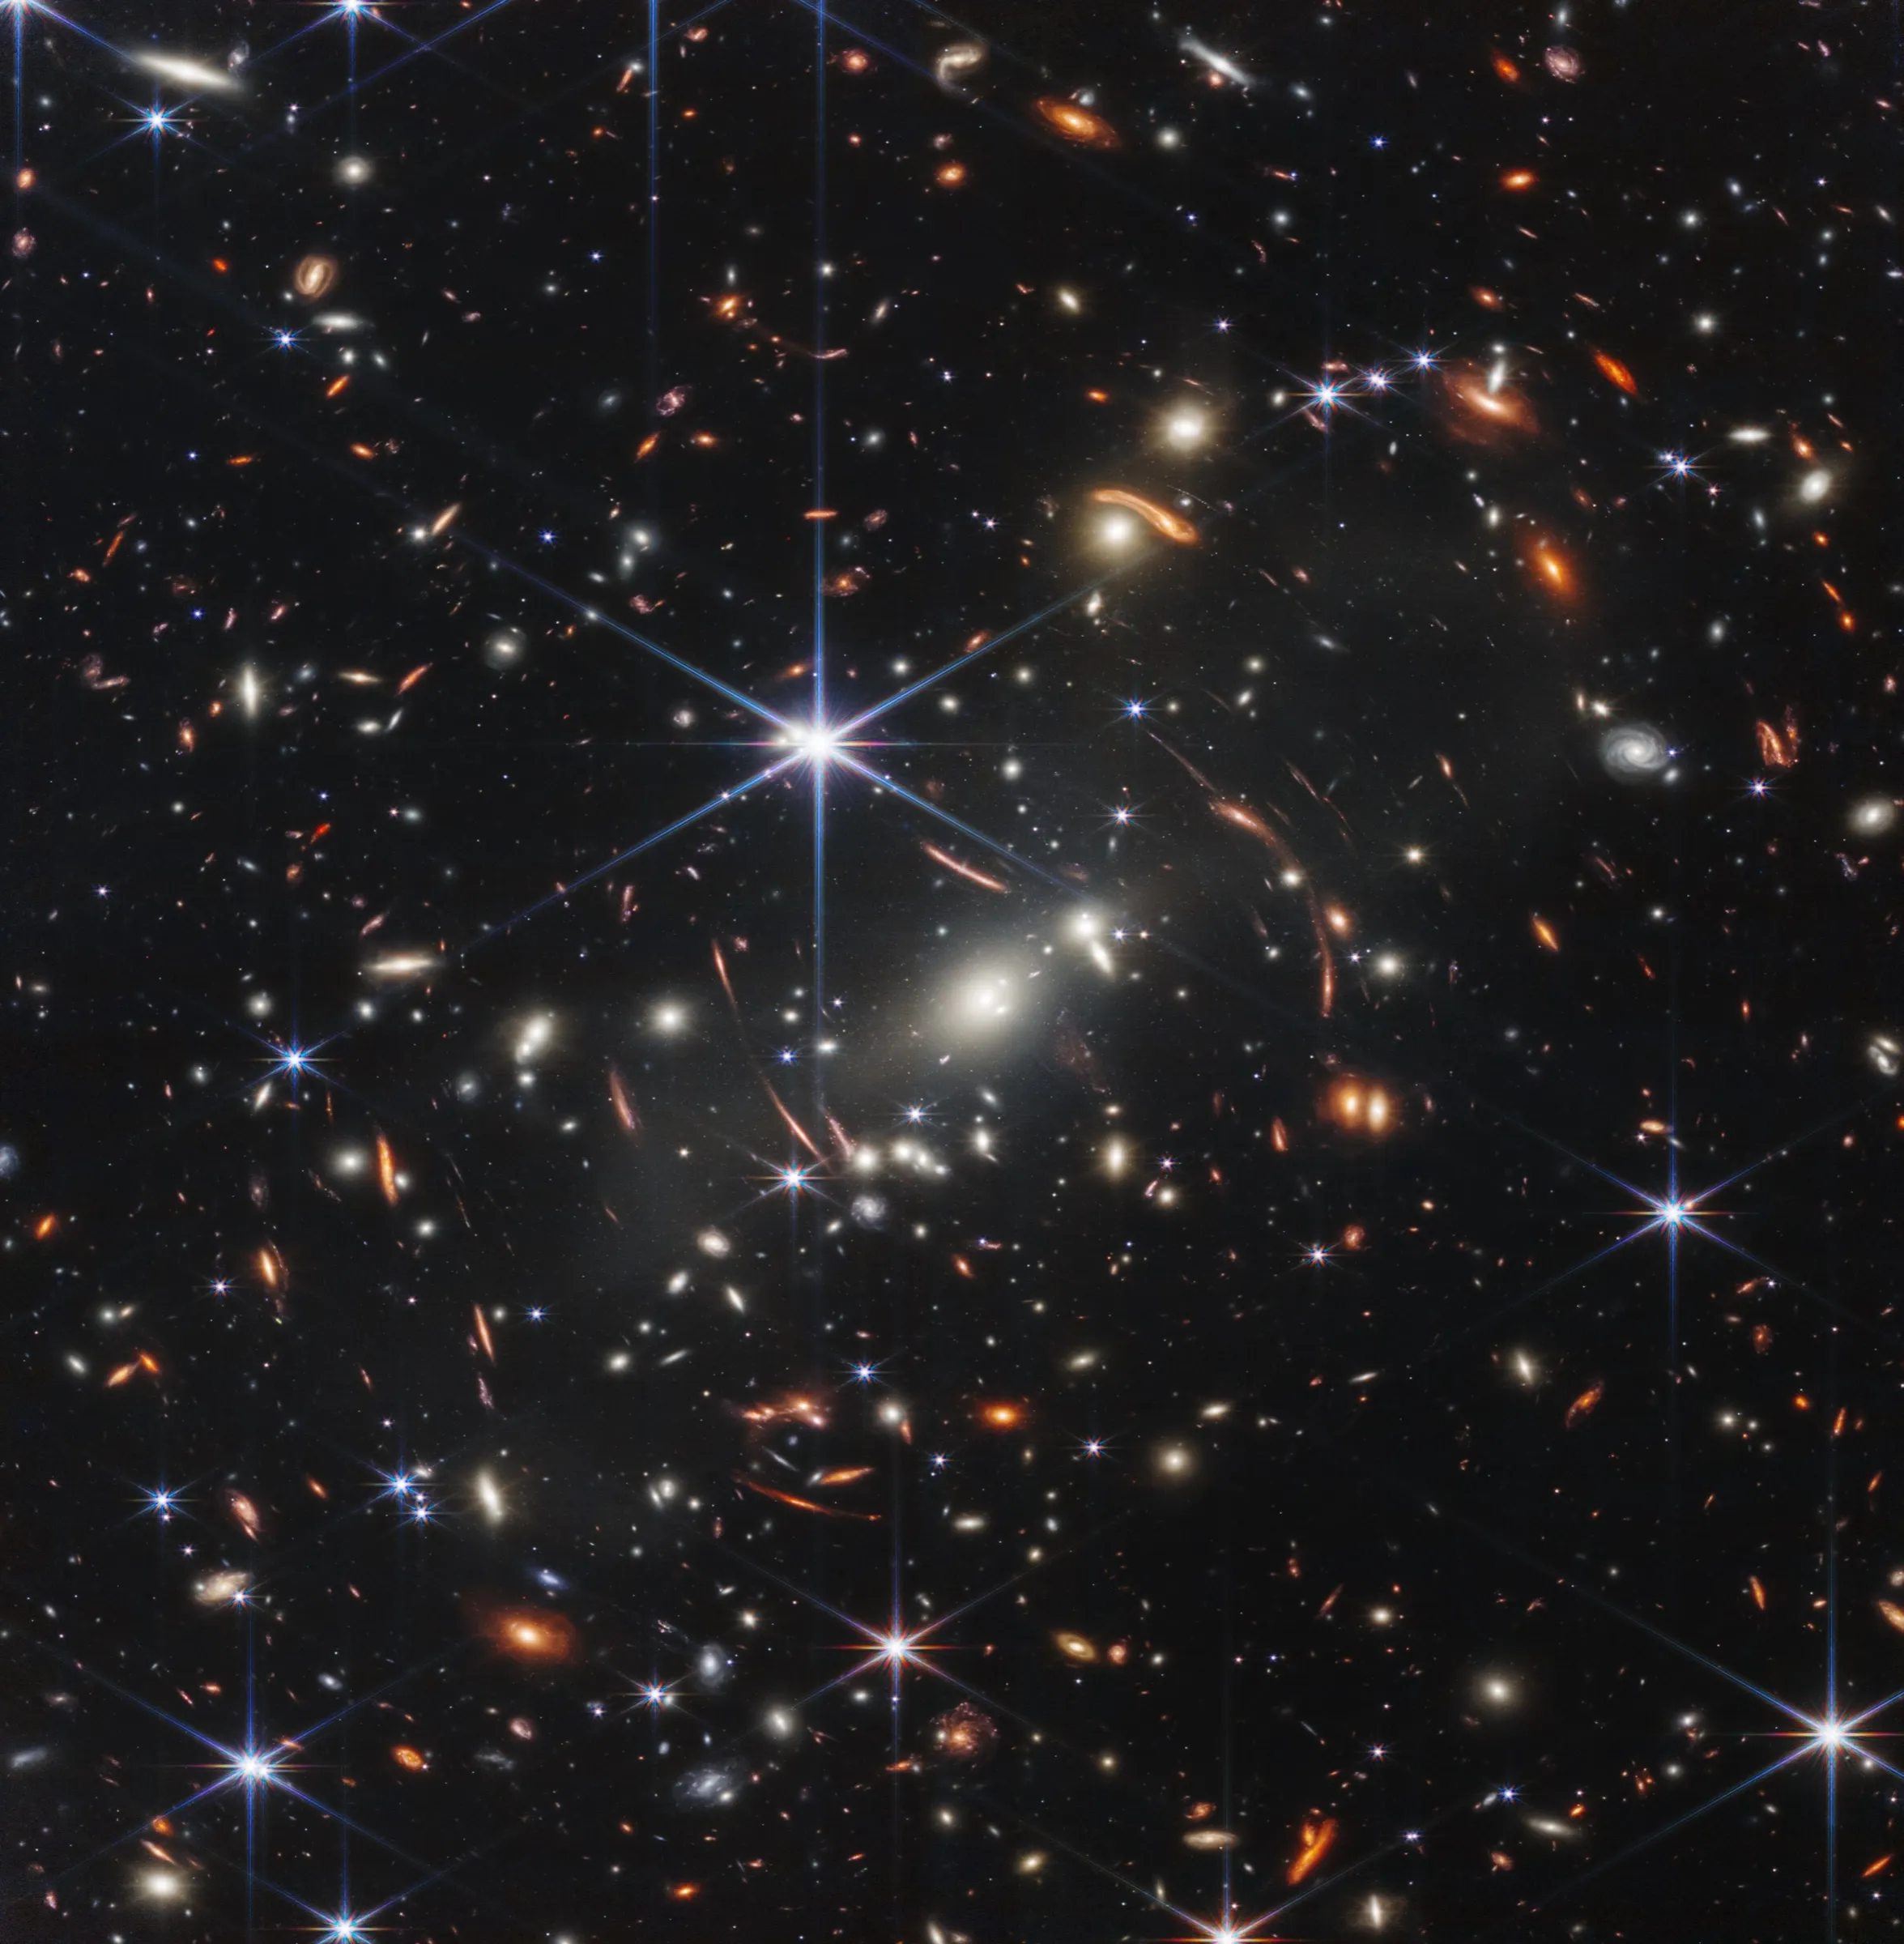
In a grain of sand, thousands of galaxies.
The nearer galaxies bend and magnify light from those behind them. In one image, we see across billions of years.
Webb observes in infrared wavelengths that our eyes cannot see, wavelengths that pass through cosmic dust that would blind an optical telescope. And in that infrared light, it can read a chemical signature: carbon dioxide[2].
The deep past became retrievable.
VI. Mapping a Billion Stars
Finally, measurement became systematic.
Earthrise showed us our planet. Gaia showed us our galaxy.
Thirty years ago, we knew precise distances to roughly a thousand nearby stars. We had measured them one by one, over years of observation. Gaia now gives positions for 1.8 billion sources. For about 1.46 billion, it also records motion and parallax—the apparent shift that reveals a star’s distance[7].
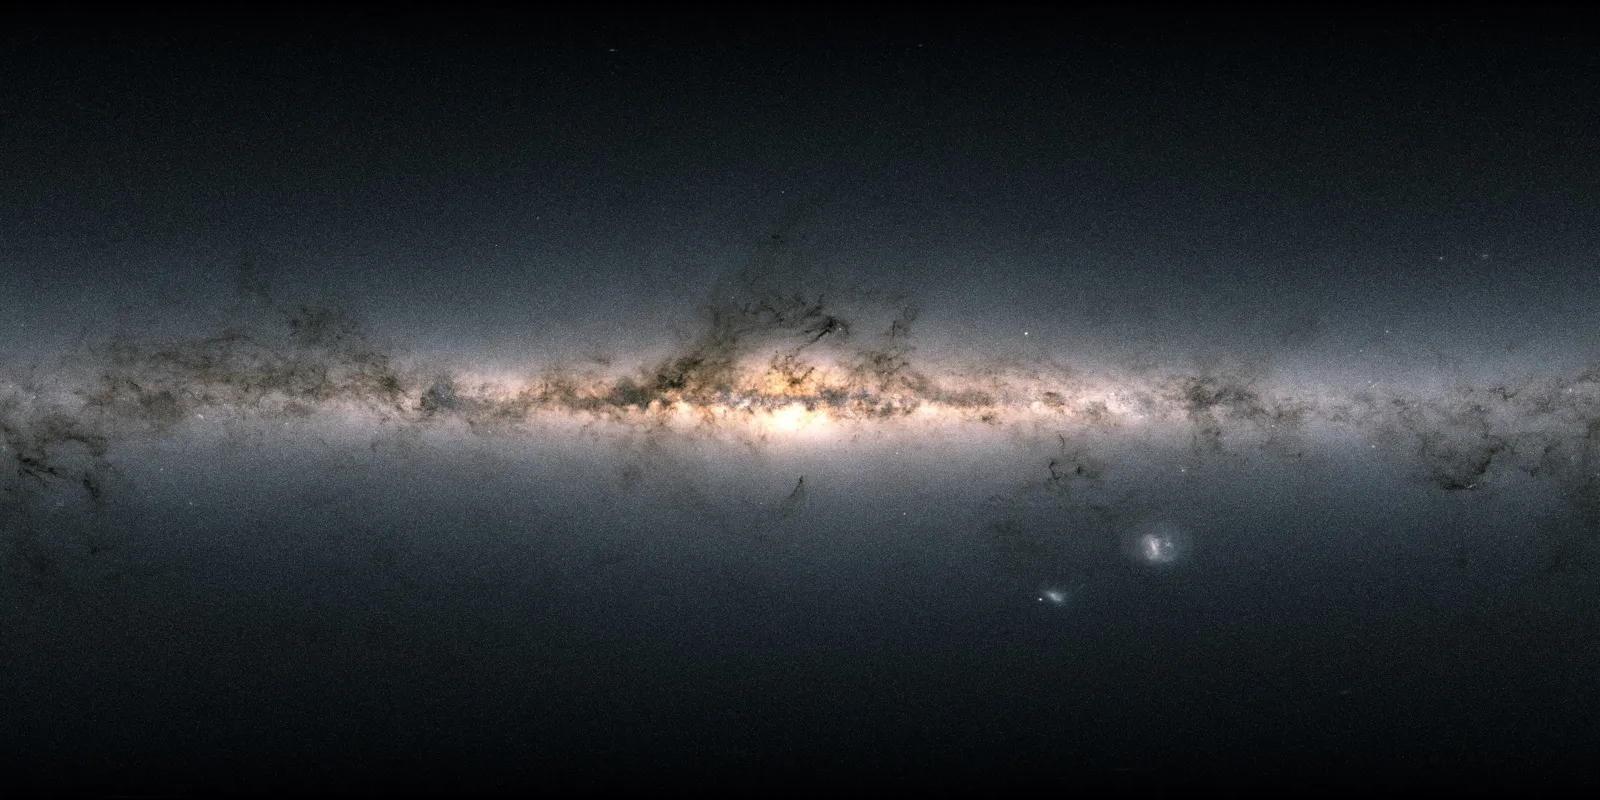
Gaia spent years measuring the same sources over and over, refining their positions and motions. Billions of measurements, reconciled into a map of our galaxy that anyone can access.
We found the universe. We kept it.
VII. A Universe We Can Revisit
Perception became abundant.
We could go back and look again.
Earthrise was a single frame.
Since 2017, Planet’s fleet has collected near-daily imagery of Earth’s landmasses at about three-metre resolution[8]. Landsat supplies the deeper record: repeated global land imaging since 1972[9]. Over fifty years of observation. Forests cleared. Glaciers retreated. Coastlines changed.
Specialised instruments track carbon dioxide and methane in Earth’s atmosphere, mapping greenhouse gas concentrations source by source[10][11][12].
The Dark Energy Spectroscopic Instrument has observed more than 47 million galaxies and quasars in three dimensions[13]. The Vera C. Rubin Observatory will record about twenty billion galaxies and a similar number of stars over ten years[14].
Abundance did not arrive.
It was always here.
What arrived was the ability to retrieve it.
After that, guessing became optional.
References
[1] NASA Exoplanet Science Institute. “NASA Exoplanet Archive.” (Over 6,000 confirmed exoplanets.)
[2] European Space Agency (ESA) / NASA / CSA (2022). “Webb Detects Carbon Dioxide in Exoplanet Atmosphere.” (Detection of CO₂ in a gas-giant exoplanet atmosphere, demonstrating transmission spectroscopy: reading starlight as it passes through a planet’s atmosphere.)
[3] LIGO Scientific Collaboration and Virgo Collaboration (2016). “Observation of Gravitational Waves from a Binary Black Hole Merger.” Physical Review Letters 116, 061102. See also: LIGO Laboratory. “Gravitational Waves Detected 100 Years After Einstein’s Prediction.” (First direct detection of gravitational waves, September 14, 2015.)
[4] LIGO Laboratory / Caltech. “LIGO Facts.” (The first detection displaced the arms by roughly one four-hundredth of a proton’s width; the instrument itself resolves changes smaller than one ten-thousandth.)
[5] Event Horizon Telescope Collaboration (2019). “First Image of a Black Hole.” NASA Science. See also: “First M87 Event Horizon Telescope Results. I. The Shadow of the Supermassive Black Hole.” Astrophysical Journal Letters 875, L1. See also: EHT’s April 2019 announcement. (First image of a black hole’s shadow, M87*, released April 10, 2019, from observations collected in 2017. The shadow’s size is consistent with general relativity.)
[6] NASA / STScI (2022). “Webb’s First Deep Field Unveiled.” See also: NASA, “Webb’s Sunshield.” (A composite of 12.5 hours of observations at different wavelengths. The foreground cluster magnifies more distant galaxies; the field spans the angle of a grain of sand held at arm’s length.)
[7] European Space Agency (ESA). “Gaia Data Release 3 Contents.” (A catalogue of 1.8 billion sources; full astrometric solutions—position, parallax, and proper motion—for about 1.46 billion; radial velocities for about 33 million.)
[8] Planet Labs PBC. “PlanetScope Monitoring.” See also: technical documentation. (Near-daily imaging of Earth’s landmasses at roughly 3–5 metre resolution.)
[9] U.S. Geological Survey (USGS). “Landsat Satellite Missions.” (A continuous record of Earth’s land surface since 1972.)
[10] NASA Jet Propulsion Laboratory. “Orbiting Carbon Observatory-2 (OCO-2).” (Satellite measurement of atmospheric CO₂.)
[11] European Space Agency (ESA). “Sentinel-5P / TROPOMI.” (Daily global monitoring of atmospheric trace gases.)
[12] GHGSat Inc. “DATA.SAT Methane Emissions Satellite Data.” See also: NASA Earthdata. “Access to GHGSat Data.” (High-resolution satellite monitoring of methane emissions and facility-level point sources.)
[13] Dark Energy Spectroscopic Instrument (DESI). “Dark Energy Spectroscopic Instrument.” (More than 47 million galaxies and quasars observed in three dimensions: the largest high-resolution 3D map of the universe to date.)
[14] Ivezić, Ž. et al. (2019). “LSST: From Science Drivers to Reference Design and Anticipated Data Products.” Astrophysical Journal 873, 111. See also: open version, arXiv:0805.2366. (Rubin Observatory / LSST reference design; roughly 20 billion galaxies and a similar number of stars expected over the 10-year survey.)