Bridge to Infinity
The 20th century tried to reach space with fire. The 21st century builds a bridge.
Three g, sustained: a firm, even weight pressing you into the reclined seat. The cabin is small. Twelve people. Everyone breathing steadily against the load.
You are inside a mountain, accelerating through an evacuated shaft bored through bedrock. The coils fire in sequence. No roar. No vibration. Just the low hum of grid electricity becoming speed. Thirty seconds. Eight hundred and fifty metres per second.
The tunnel curves toward vertical. The push shifts sideways, centripetal, building. Three g becoming five, briefly touching seven at the tightest bend. Twenty seconds of roller-coaster geometry through the mountain’s shoulder. Then it eases.
And silence.
The vehicle coasts up the pylon in vacuum. Sixteen seconds of weightlessness. Through the window, the sky is black. Stars steady against deep indigo. The curve of the Earth runs pale along the southeast horizon. Twenty kilometres up, the air outside is less than a tenth of what it was on the ground.
The exit is gentle. At seven hundred metres per second, the thin air presses softly, less dynamic pressure than a rocket ever faces at Max Q. The lifting body banks: one smooth roll, about one g. Then the engine lights: a nudge, under one g, building over seven minutes to five g in the final seconds as propellant burns off. Most of the burn is below three g. Quieter than turbulence.
Finally. Cutoff.
Orbit.
I. The Atmosphere Tax
The hardest part of reaching orbit is the atmosphere.
A spacecraft in low Earth orbit moves at roughly 7.8 km/s. Fast enough to circle the planet in ninety minutes. But reaching orbit from the ground costs closer to 9.2 km/s.[1] That extra 1.4 km/s is almost entirely wasted fighting gravity and air. These losses compound exponentially through the rocket equation.[2]
Without Max Q, we could throw things into orbit with cannons. Max Q shapes everything. Fairing geometry, structural mass, throttle schedules, abort modes: every design decision serves one window. Rockets are built around ninety seconds of dense air.
Reusable rockets will bootstrap the space economy, pushing costs toward $50–200/kg and seeding the first lunar industry. But chemical rocketry through dense atmosphere faces a throughput ceiling that has nothing to do with cost. Every launch deposits combustion products, soot, aluminium oxide, water vapour, directly into the stratosphere, where they accumulate.
NOAA-affiliated research shows non-linear stratospheric ozone and climate damage at roughly 10× current launch rates.[3] Measurements already detect spacecraft re-entry metals in stratospheric aerosol at today’s cadence.[4] Moving civilisation off-Earth requires not 10× but 400–1,000× current orbital throughput, megatonnes per year, sustained for decades.
Rockets are the horse. The Bridge is the railroad.
II. The Needle
Previous attempts at assisted launch failed because they solved the wrong problem. Air launch (Virgin Orbit, Pegasus) carries a rocket to ~10 km at Mach 0.8, roughly 3% of orbital velocity. The rocket still does 97% of the work, still fires through dense atmosphere, still uses a sea-level-compromise engine. The assist changes nothing that matters.
SpinLaunch and sea-level railguns provide more speed but exit into the densest possible air. Dynamic pressure at 2 km/s at sea level is 60× a rocket’s Max Q. These systems add velocity at the wrong altitude. The opportunity is higher exit, above the atmosphere that forces every compromise.
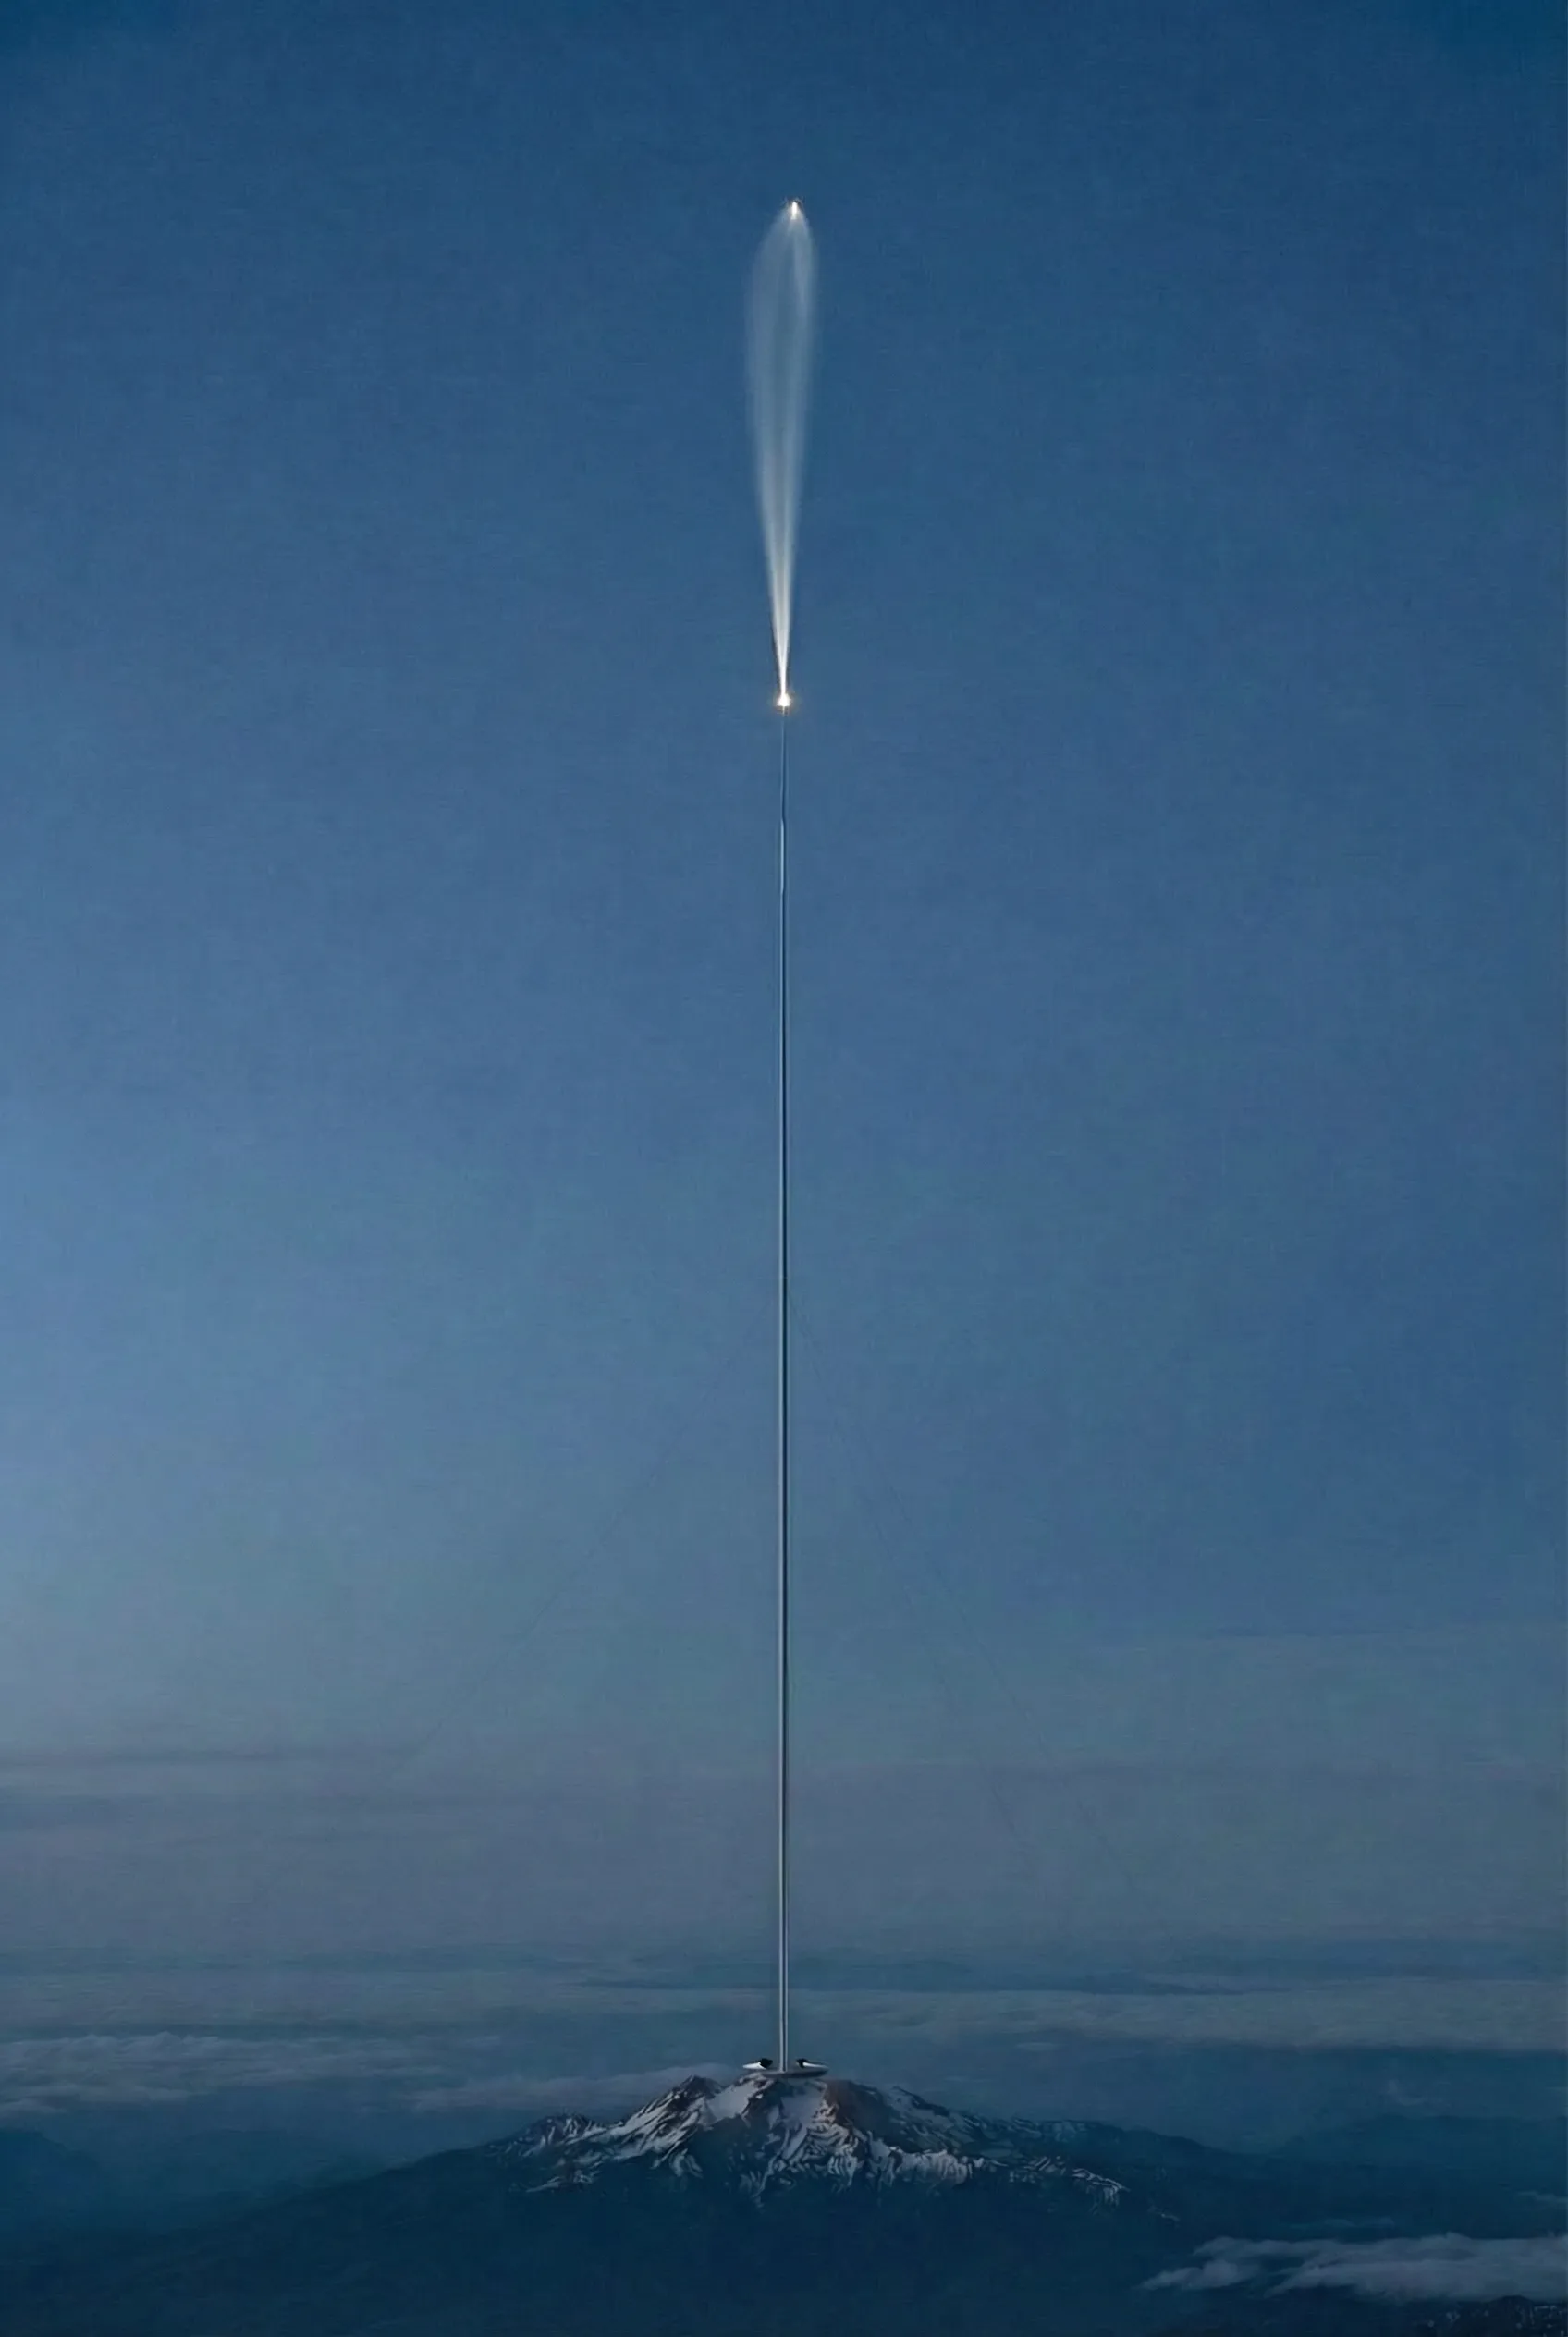
The answer is infrastructure: a vertical electromagnetic launcher, embedded in a mountain, reaching through the stratosphere.
Meridian.
Three elements.
A tunnel bored through the mountain accelerates the vehicle through bedrock to exit speed.
A pylon carries the exit from the summit into the stratosphere.
At altitude, the lifting body banks: thin air trading for horizontal velocity before the engine has burned a gram of propellant (Appendix C2, E).
Meridian solves atmosphere.
Twenty kilometres is where three conditions coincide. Thick enough for a lifting body to bank: 7% of sea-level density gives real aerodynamic authority at even modest speeds. Sparse enough that the exit pulse is brief and structurally manageable, gentler than re-entry, which is already solved. And high enough that the aerodynamic bank carries the vehicle to ~28–29 km before the engine lights.
At that altitude, atmospheric pressure is under 2% of sea level. The engine fires in effectively true vacuum from ignition, at 99%+ of its theoretical efficiency. No other exit altitude satisfies all three as cleanly.
The bank itself is nearly free. Velocity components add in quadrature: convert a vertical vector into a horizontal one at speed, and the total barely changes. Call it the Pythagorean Dividend (Appendix C2). Gain a hundred metres per second sideways and the climb gives up seven. The exchange rate is one per cent. The thin air above becomes a harvestable resource. The stratosphere transforms into a gearbox. It turns the launcher’s vertical throw into orbital velocity, and charges almost nothing for the exchange.
Electricity provides the throw. Thin air provides the turn. Vacuum provides the burn. Each layer does less work because the one before it did more. The rocket equation amplifies every saving exponentially.
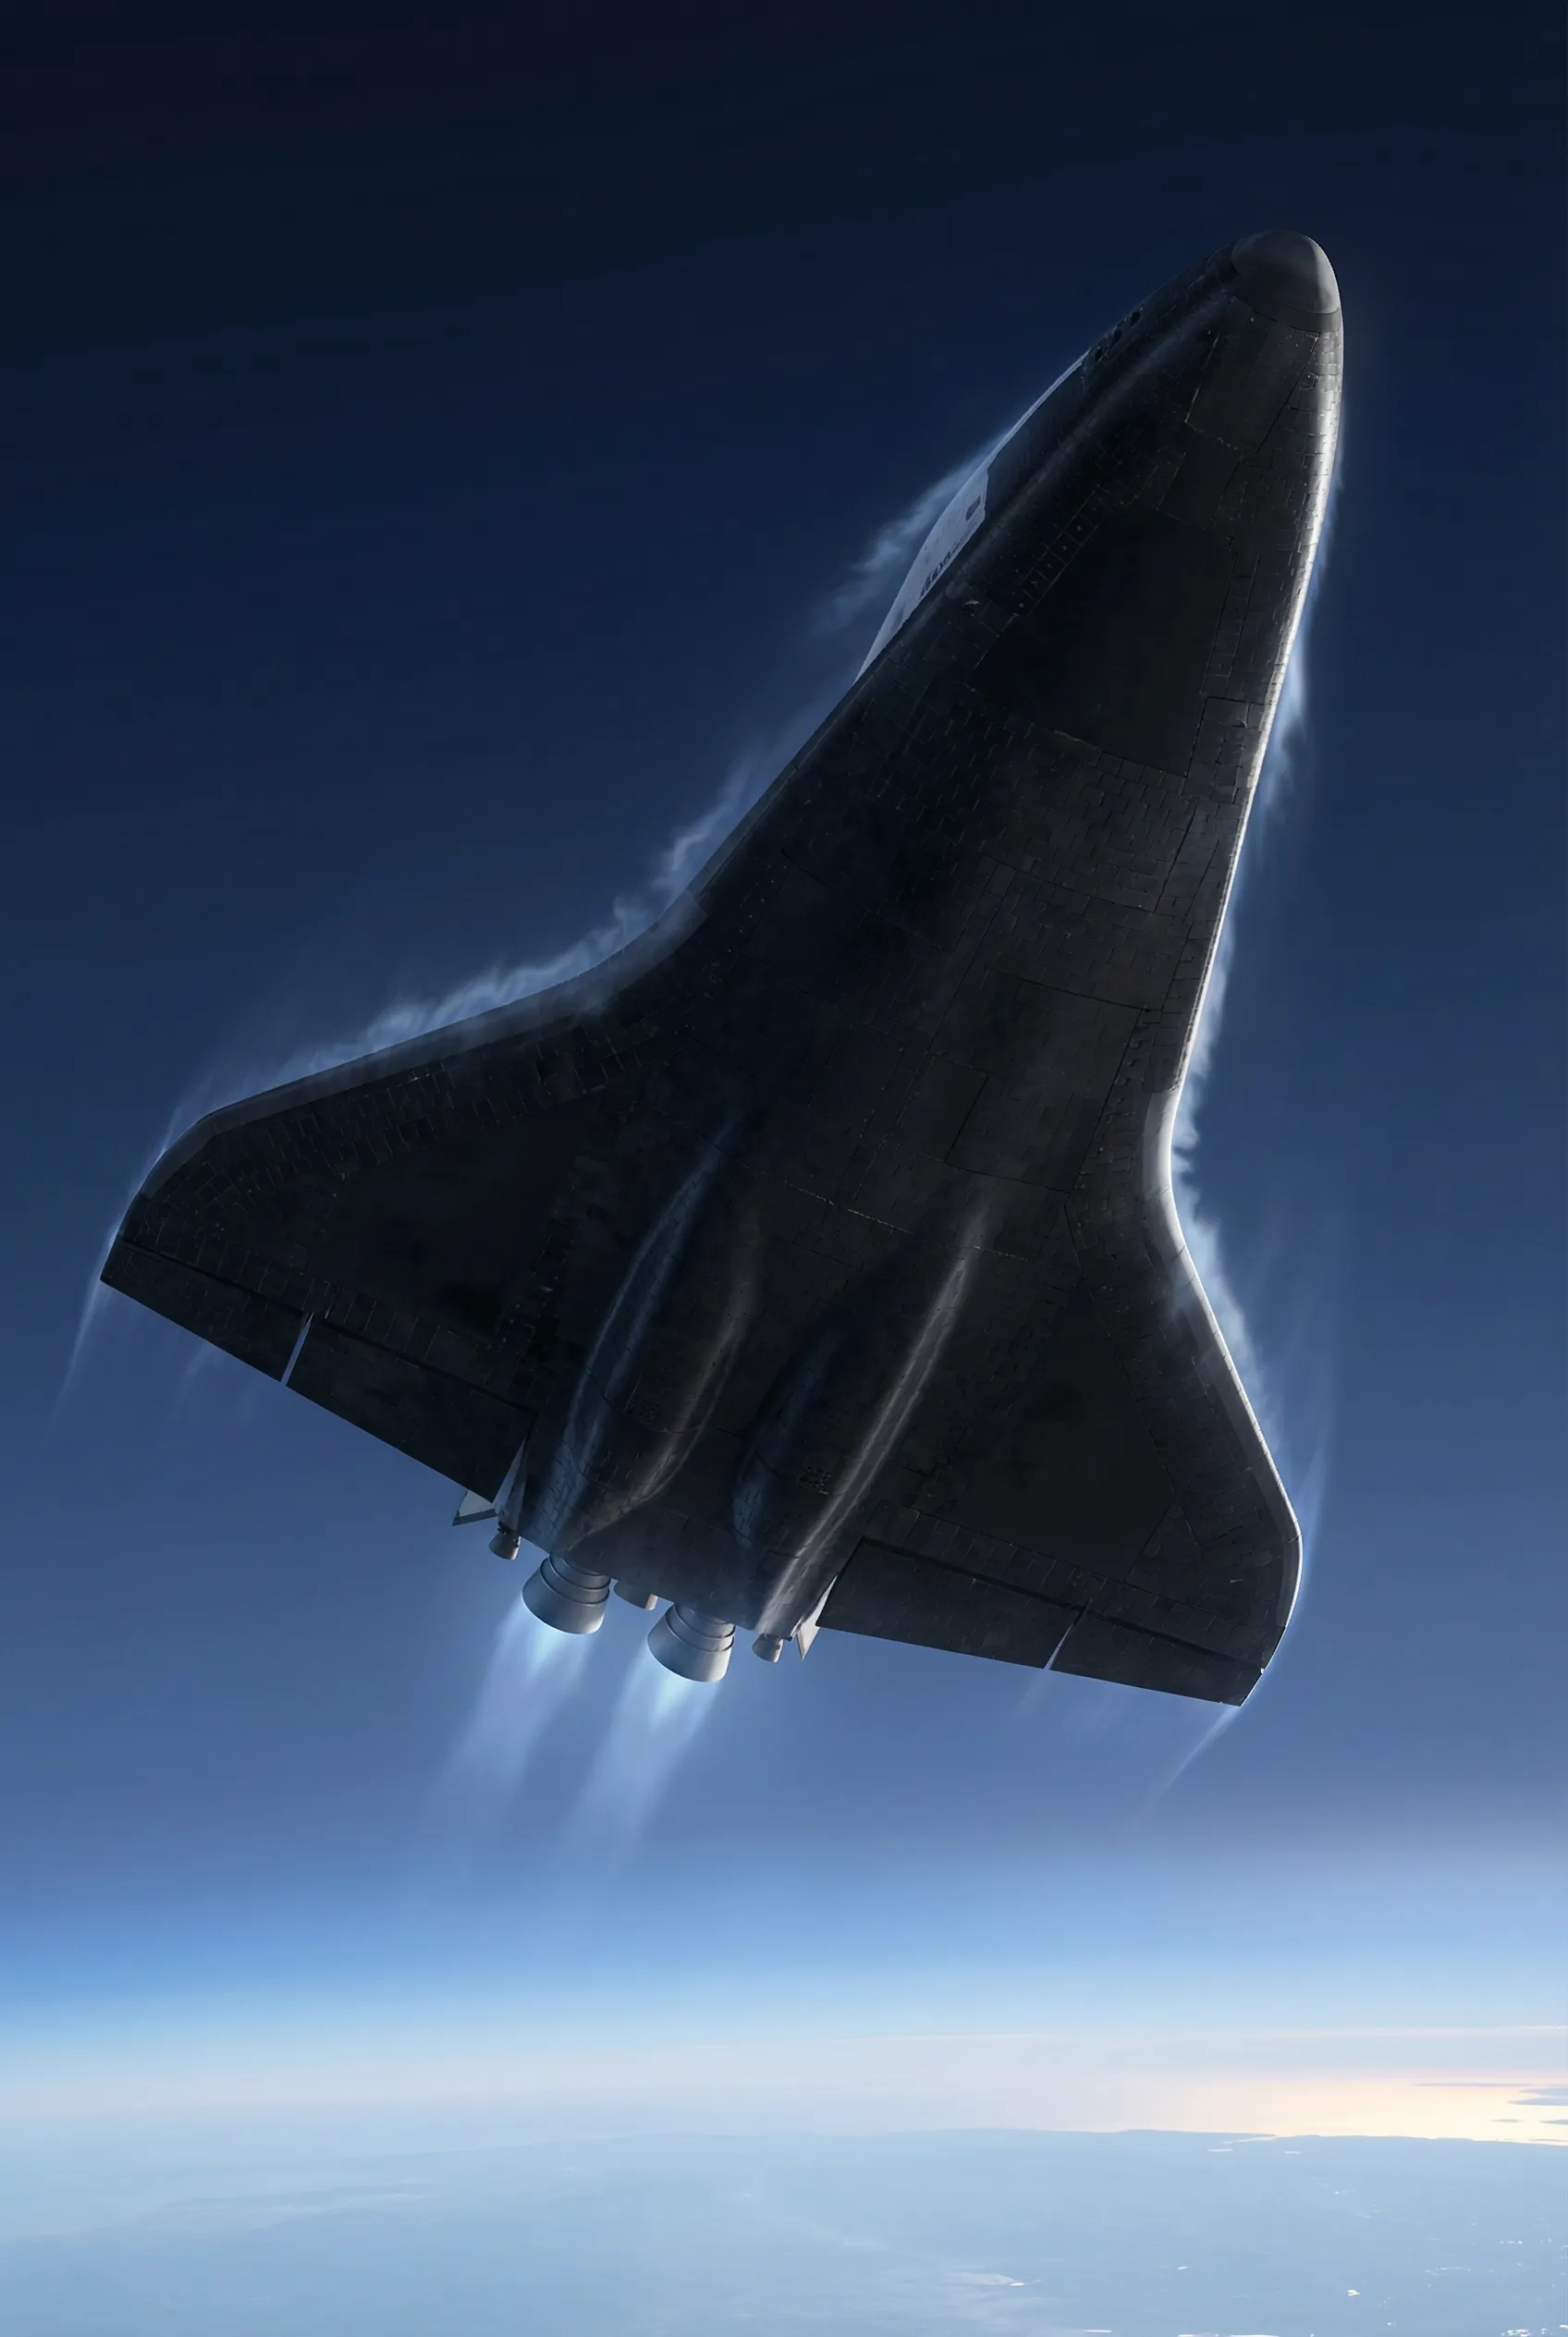
III. The Workhorse Stage
Once the atmosphere is someone else’s problem, the orbital stage transforms.
Call it Halcyon. It inherits none of a rocket’s atmospheric compromises. It ignites in near-vacuum, already banked toward the horizon, already carrying aerodynamically earned horizontal velocity. Its nozzle can expand fully for space.
Any lifting body rated for re-entry handles the exit pulse (Appendix C3). The hardest part is coming home. That problem is already solved.[5]
Halcyon is rugged, built for repeated use. Its structural mass earns its place: the same planform that handles the bank is the planform that lands on a runway.
And it can use hydrogen.
Ground vehicles default to dense propellants that survive Max Q. Hydrogen offers far higher exhaust velocity, but its bulk punishes sea-level flight. Meridian removes that constraint. The engine fires a pure vacuum nozzle at full expansion ratio. It is like the second stage of a two-stage rocket.[6]
| Propellant | Vacuum Isp (s) | Propellant saving vs all-rocket baseline |
|---|---|---|
| Kerolox | 348 | 33% |
| Methalox | 363 | 39% |
| Hydrolox | 465 | 64% |
| Nuclear thermal (H₂) | ~900 | 88% |
100 t cargo to LEO, 20 km exit altitude. Human-rated launch runs a few points lower. The full per-altitude table is in Appendix D.
Halcyon needs a large planform for the aerodynamic bank and runway landing. Hydrogen can fill that planform with useful propellant instead of dead structure. Hydrolox is the near-term workhorse. Nuclear thermal propulsion is the upgrade (Appendix M).[7]
Engineers have chased the spaceplane since the 1960s. The mass budget never closed. Ground-launched SSTO fails for fundamental mass-budget reasons. The X-33 and VentureStar died here (Appendix Q). Meridian moves the starting line to 20 km for vacuum engines. The same SSTO closes from altitude.
The mountain carries what the vehicle never could.
IV. The Port, the Locomotive, the Container
The difference between a space programme and a space economy is cadence.
Cadence requires infrastructure built like transport. So a mature orbital economy looks more like ports, rail, and container shipping.
The port. Meridian is fixed infrastructure, used constantly, maintained on schedules, amortised over decades. It never moves. Its marginal cost per launch is electricity and upper-stage propellant.
The locomotive. Halcyon: a reusable lifting body, optionally crewed, that mates with Meridian, completes orbital insertion in near-vacuum, glides back to a runway, and turns around for the next flight.
The container. Standardised cargo pods, sized to the launcher bore and the shuttle bay. The container is cheap. The locomotive is expensive. You replace containers. You maintain locomotives.
The throughput changes the conversation. In 2024, all of humanity put roughly 2,171 tonnes into orbit.[8] One launcher at daily cadence delivers more than ten times that. Faster cadences scale toward 400× the world’s annual upmass at a shot an hour.
V. The Two Mass Drivers
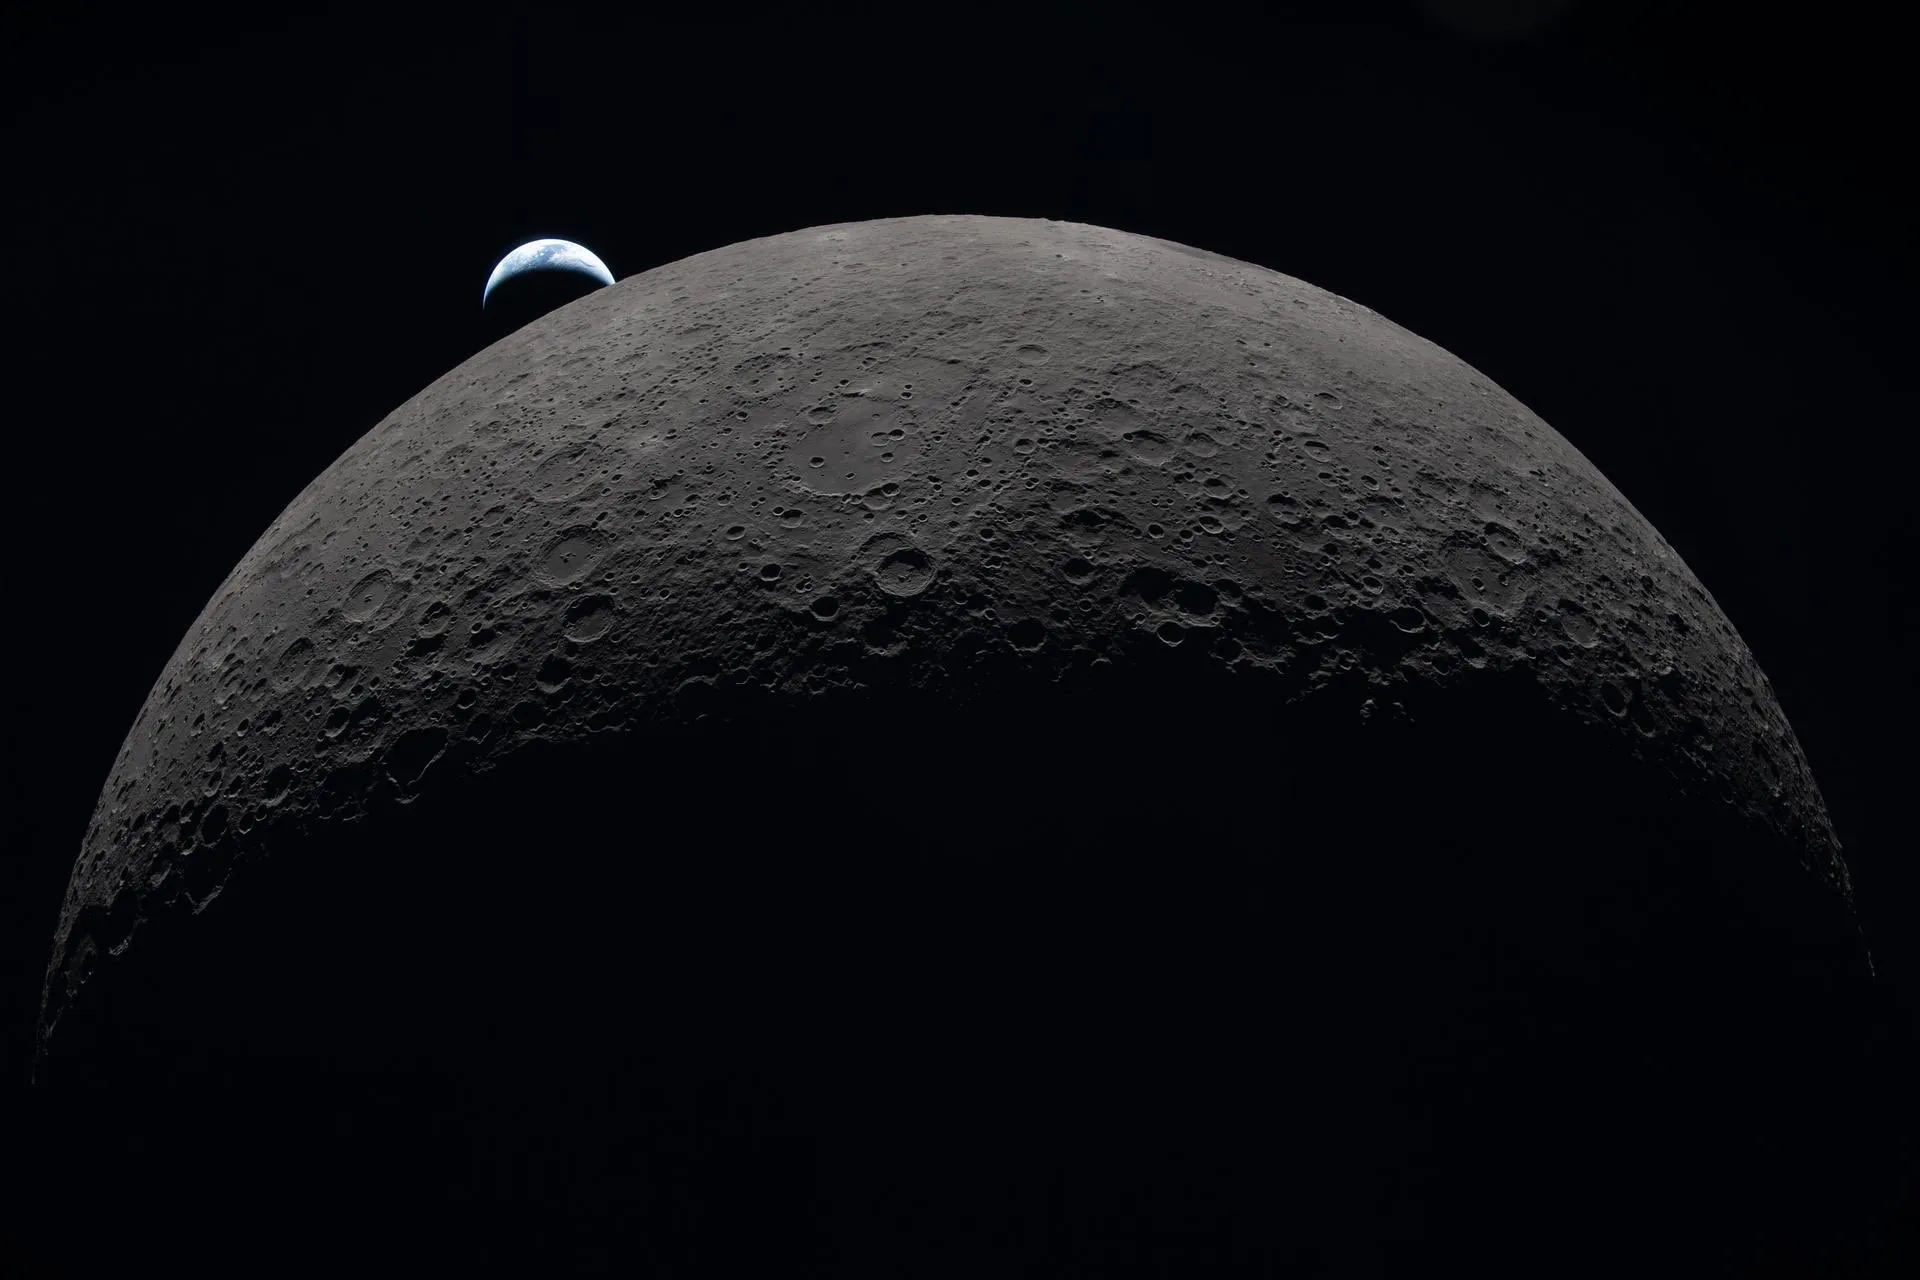
The Moon is the natural source of bulk mass for space.
The Moon’s gravity well is 22 times shallower than Earth’s.[9] The energy to lift a kilogram of structural aluminium from the Moon to cis-lunar orbit is less than one-twentieth the energy to lift the same kilogram from Earth.[10] And the Moon has no atmosphere, no vacuum tube, no aerodynamic heating, no Max Q. A lunar mass driver is roughly 14 km of track at 20g under open sky, powered from crater rims where the Sun almost never sets.
The marginal energy cost of material throughput from the Moon into cis-lunar orbit works out to roughly $0.04/kg at lunar solar power prices. Not $40. Not $4. Four cents.[11]
The Moon’s crust is exactly the inventory a space civilisation needs for bulk construction: oxygen, silicon, aluminium, iron, magnesium, calcium, titanium.[12] Structural metals, glass, ceramics, radiation shielding, the heavy, voluminous things that dominate construction mass and are expensive to launch from Earth because there is so much of them.
The round-trip light time to the Moon is about 2.6 seconds, fast enough for teleoperation of industrial robots, excavators, and fabrication systems.[13] The first lunar industrial base runs on machines and a data link.
That pairing resolves into a single asymmetry.
The Moon exports mass at the cost of electricity.
An O’Neill-scale rotating habitat for 10,000 people might mass 150,000 tonnes. If the Moon supplies 90% of that as structural bulk, Earth only needs to export roughly 15,000 tonnes per habitat, about 1.5 tonnes per person. As orbital fabs mature, the per-capita burden decays toward an irreducible floor of genuinely Earth-origin things: semiconductors, biological diversity, precision instruments, cultural capital. The full decay model is in Appendix L.
The Earth launcher supplies complexity, not mass. Once that distinction is clear, the constraint on how many people can live off-Earth shifts from launch capacity to lunar industrial throughput. Those are engineering and capital problems with known analogues in terrestrial heavy industry.
One thing does not decay: ferry overhead, the vehicle mass, propellant, life support, and safety reserves required to physically transport a human being. That overhead compresses through reuse and scale. It asymptotes rather than vanishes.
It is why population migration lags industrial migration: cargo economics improve faster than passenger economics. The crossover arrives only once ferry costs compress far enough that millions can choose to go.
Earth exports the blueprint. The Moon exports the bricks. Cis-lunar space builds the city.
VI. The One-Light-Second Neighbourhood
The cost of orbit is a solved problem. A space economy needs something more: coherence.
An economy needs supply chains that close, transactions that settle, machines that take instructions. All of that requires communication that is fast enough to feel like one place. Within about 380,000 km of Earth, round-trip latency stays under a second.
Beyond that shell, delay accumulates. Coordination degrades. The one-light-second neighbourhood is the radius within which cis-lunar space functions as a single economy rather than a collection of isolated outposts.[14]
Meridian makes orbit cheap. Latency defines how far the economy stretches.
Inside that shell, industry migrates in a specific order.
Heavy industry goes first: smelting, refining, chemical processing generate heat and waste that Earth’s biosphere must absorb. In space, waste heat radiates to 2.7 K. Feedstock arrives from the Moon. Power follows industry, because industry consumes it. In high orbit, the Sun never sets. Computation follows power. Then workers. Then families. Then cities.
Each arrival depends on the one before it. Population follows closed logistics, the same way every city in history was a port or a crossroads before it was a home.
VII. The Great De-Industrialisation
For three centuries, industrial civilisation has used Earth’s atmosphere as a chimney, its rivers as coolant, its crust as a mine, and its ecosystems as a buffer against the side effects of production.
Meridian changes that.
Once heavy industry can operate in space, powered by continuous solar energy, fed by lunar material, cooled by radiators facing the void, the pressure on Earth’s biosphere begins to reverse.
The atmosphere stops absorbing industrial waste heat. The oceans stop receiving runoff from extraction. Mines close because their products are better sourced from the Moon. Smelters, refineries, and chemical plants migrate to orbital platforms where their emissions harm nothing.
Space industry manufactures infrastructure for space residents: habitat shells, solar arrays, structural trusses, propellant tankage, radiator panels. The output stays in space because the customers are in space. At scale, the orbital economy consumes its own output to grow.
Earth becomes selective about what it hosts. Biology. Culture. Agriculture on land that was never strip-mined. Forests that were never cleared for industry. Rivers that run clean because no one is using them as coolant.
The Great De-Industrialisation asks no one to sacrifice. It waits for the orbital economy to undercut terrestrial production on bulk output. Energy, materials, and thermal management all favour space once the logistics exist. The economics will pull industry off Earth the same way they once pulled it out of cottage workshops and into factories.
Earth needs civilisation to grow large enough to move its heaviest footprint somewhere else. Give it a larger canvas. The footprint shrinks.
Meridian has its own costs: solar land use, electrolysis water demand, re-entry aerosols, orbital debris governance. Each demands serious engineering (Appendix N).[15][4][16][17] But the sum of managed externalities at scale is categorically smaller than continuing to use Earth’s biosphere as a process buffer.
Summary
Industry migrates because the orbital alternative undercuts Earth on energy, materials, and thermal management. Earth stops being the default site of production, and begins to recover.
VIII. The Cathedral
This will be a programme of infrastructure built across generations, the way cathedrals were built, by people who knew they would never see the finished work, for communities that did not yet exist.
Each phase depends on the one before it. Rockets bootstrap the lunar economy. The lunar economy justifies Meridian. Meridian feeds the orbital build-out. The build-out creates the demand that pulls industry, then populations, off-world. The chain ends with the free starships: vessels that depend on nothing before them.
Once Meridian is built, the cost of orbit drops to electricity and process engineering. The Moon supplies the mass. Earth supplies only the complexity. Cis-lunar industry builds what cis-lunar residents need.
And Earth becomes what it always could have been.
The limit was only ever twenty kilometres.
Technical Appendix
Key calculations supporting quantitative claims in the essay body. Inline citations map to the reference section below.
A. Atmospheric Density and the 95% Line
The launcher exit dynamic pressure is high and useful.
Using the U.S. Standard Atmosphere (1976),[18] air density falls approximately exponentially with altitude:
| Altitude (km) | (kg/m³) | % of sea-level density | Cumulative mass above (%) |
|---|---|---|---|
| 0 (sea level) | 1.225 | 100% | 100% |
| 10 | 0.414 | 33.8% | ~26% |
| 20 | 0.089 | 7.3% | ~5.5% |
| 25 | 0.039 | 3.2% | ~2.5% |
| 30 | 0.018 | 1.5% | ~1.2% |
Atmospheric pressure at altitude approximates the weight of the overlying air column: , where km is the scale height. Since pressure is proportional to the mass of air above, ~94% of atmospheric mass lies below 20 km, ~97% below 25 km, and ~99% below 30 km (the body’s “95% below 25 km” is the conservative round).
Dynamic pressure at launcher exit:
| Exit altitude | (kg/m³) | = 2.5 km/s | = 3.0 km/s |
|---|---|---|---|
| 20 km | 0.089 | 278 kPa | 401 kPa |
| 25 km | 0.039 | 122 kPa | 176 kPa |
| 30 km | 0.018 | 56 kPa | 81 kPa |
For comparison, a typical rocket experiences Max Q of 30–40 kPa at ~12 km altitude and ~500 m/s. A lower exit (20–25 km) exposes the vehicle to more air. More air means higher aerodynamic authority for the bank manoeuvre that converts surplus vertical velocity into horizontal momentum (Appendix C2).
The optimum exit altitude is a trade between terminal pylon height (higher = shorter, cheaper pylon) and aerodynamic turn potential (lower = more free delta-v). A 20 km exit with a purpose-built lifting body can harvest ~500 m/s of horizontal velocity aerodynamically, and at the exponential rates of the rocket equation, that is not small. The high dynamic pressure is brief: the vehicle climbs at 3 km/s through rapidly thinning air, moving vertically rather than pitching over in the densest layer.
B. Launch Budget Decomposition
The benefit of altitude is atmospheric bypass, not orbital mechanics.
A representative NASA launch budget for a 200 km circular orbit:[1]
| Component | (km/s) | Notes |
|---|---|---|
| Ideal surface-to-orbit | 7.97 | Vis-viva from surface to 200 km circular |
| Earth rotation credit | −0.41 | At 28.5° latitude (Cape Canaveral class) |
| Gravity loss | +1.10 | Propellant spent fighting gravity during ascent |
| Drag loss | +0.50 | Propellant spent overcoming aerodynamic drag |
| Steering loss | +0.10 | Trajectory shaping and guidance corrections |
| Total rocket | 9.26 |
Circular orbital speed at 200 km: km/s.
What the launcher removes. A near-vertical electromagnetic assist to ~20 km altitude and ~3 km/s upward velocity eliminates or sharply reduces:
- Drag loss (~0.5 km/s): payload exits above 93%+ of the atmosphere
- Gravity loss (~0.9–1.1 km/s): all but eliminated. The launcher does the vertical climb electromagnetically (no engine burn, no gravity loss during ascent). The lifting body banks immediately after exit, converting vertical momentum into horizontal momentum aerodynamically before engine ignition, so the powered burn begins near-horizontal and nearly perpendicular to the gravity vector
- Steering loss (~0.1 km/s): the vacuum stage can pitch directly to optimal burn attitude
- Additional: the aerodynamic bank converts ~100–500 m/s of surplus vertical velocity into horizontal momentum at zero propellant cost, depending on vehicle class (~500 m/s for purpose-built cargo at 3 km/s, ~100 m/s for human-rated at 700 m/s with full bank. See Appendix C2)
Estimated reduction in required rocket : ~1.5 km/s from the launcher itself (gravity, drag, steering losses eliminated), plus ~500 m/s from the aerodynamic turn for a purpose-built cargo vehicle at 20 km exit, bringing the orbital stage’s duty to ~7.2 km/s. For human-rated flights at ~700 m/s exit: ~100 m/s aero credit, engine duty ~7.8 km/s (see Appendix C2 for the full derivation).
Altitude vs velocity contribution. The change in required circular orbital speed due to the slightly larger orbital radius at 30 km is:
This is negligible. Height alone does not meaningfully reduce orbital velocity requirements. The benefit of altitude is atmospheric bypass, not orbital mechanics.
C. Ballistic Arc and Burn Window
The table below shows the unpowered ballistic arc—what happens if the vehicle coasts without igniting. In practice, the stage ignites much earlier (seconds after exit, once banked to near-horizontal attitude), so the actual trajectory diverges from this arc almost immediately. The unburned case defines the available vacuum flight window and the altitude envelope.
From an exit altitude with vertical velocity , the additional height gained on an unburned arc:
where m/s² at 20 km (negligibly less than surface ).
| Exit altitude | (km/s) | Additional height | Apogee altitude | Time to apogee | Total time above exit |
|---|---|---|---|---|---|
| 20 km | 0.7 (human) | 25 km | 45 km | 71 s (1.2 min) | ~2.4 min |
| 20 km | 2.5 | 319 km | 339 km | 255 s (4.3 min) | ~9 min |
| 20 km | 3.0 (cargo) | 459 km | 479 km | 306 s (5.1 min) | ~10 min |
| 25 km | 3.0 | 459 km | 484 km | 306 s (5.1 min) | ~10 min |
| 30 km | 3.0 | 459 km | 489 km | 306 s (5.1 min) | ~10 min |
At the cargo reference design point—3 km/s from 20 km—the unburned arc gives roughly 10 minutes above the dense atmosphere. In practice the lifting body banks immediately: at 3 km/s and 7% of sea-level density, the bank harvests ~500 m/s of free horizontal delta-v (Appendix C2). The stage lights seconds after exit, already carrying horizontal speed earned aerodynamically. The 10-minute window is the envelope. The burn fills most of it.
For a cargo hydrolox stage with km/s (after ~500 m/s aero credit at 20 km), a 5-minute burn (300 s) gives average acceleration m/s², or about 2.4 g—a reasonable upper-stage acceleration for cargo. The crewed vehicle burns for ~7 minutes from 0.9 g to 5 g (85% below 3 g); its 2.4-minute ballistic window is extended by wing lift and centrifugal effects, so the burn fits comfortably. See Appendix E.
C2. Aerodynamic Turn Optimisation
The launcher oversupplies vertical velocity: the vehicle exits with ~3 km/s upward but only needs ~500–700 m/s of residual vertical to stay above the atmosphere during the burn. The surplus is available for conversion to horizontal momentum. The lifting body can do that aerodynamically, at zero propellant cost. Two questions remain: how much, and what sets the optimum.
Closed-form solution. Air density falls exponentially with altitude: where km is the scale height. For a vehicle climbing at velocity , altitude increases as , so .
The lateral acceleration from aerodynamic lift is:
Integrating over the entire climb (the exponential decay makes the integral converge):
This is exact in the limit of constant climb speed (a good approximation: the vehicle loses only ~2–3% of its 3 km/s to gravity during the ~3 s of significant aero authority). Aero delta-v scales linearly with exit density , exit speed , scale height , and the vehicle’s lift parameter .
Since , every km lower in exit altitude doubles the free delta-v (each 7.5 km multiplies it by ). This is why exit altitude matters so much.
Wing loading governs the result. A concern: in the formula is the full vehicle mass at exit—cargo, dry stage, and all propellant. A 50 t payload with hydrolox propellant for a 7.2 km/s burn masses roughly 484 t at exit. Does the formula collapse?
No. The vehicle must also land on a runway after delivering its cargo. Landing wing loading constrains the planform area in proportion to the post-burn mass. At exit, , so substituting :
The absolute mass cancels. The aero delta-v depends on landing wing loading (), hypersonic lift coefficient (), exit density (), and mass ratio (). A heavier vehicle needs proportionally more planform to land; that extra planform provides exactly the lift authority for the bank.
For a purpose-built cargo drone landing at N/m² (approach speed ~130 knots, comparable to a regional airliner) with at ~30° hypersonic AoA, carrying 50 t of payload and ~390 t of hydrolox at exit (): planform area ~490 m² (~31 m × 16 m), total exit mass ~484 t. At 20 km exit this gives ~500 m/s—half a kilometre per second of free horizontal velocity, earned from the air itself.
Design envelope. For a 50 t payload at km/s, hydrolox, , solved self-consistently ( and co-determined):
| Exit altitude | (kg/m³) | (kPa) | Aero (conservative) | Aero (purpose-built) | Peak lateral (conservative) | Peak lateral (purpose-built) |
|---|---|---|---|---|---|---|
| 15 km | 0.195 | 878 | 527 m/s | 1,097 m/s | 21 g | 44 g |
| 18 km | 0.122 | 549 | 329 m/s | 686 m/s | 13 g | 28 g |
| 20 km | 0.089 | 401 | 240 m/s | 501 m/s | 10 g | 20 g |
| 22 km | 0.065 | 293 | 175 m/s | 366 m/s | 7 g | 15 g |
| 25 km | 0.039 | 176 | 105 m/s | 219 m/s | 4.3 g | 9 g |
| 28 km | 0.024 | 108 | 65 m/s | 135 m/s | 2.6 g | 5.5 g |
| 30 km | 0.018 | 81 | 49 m/s | 101 m/s | 2.0 g | 4.1 g |
Conservative: N/m², , (smaller planform, moderate bank). Purpose-built: N/m², , (large planform, aggressive bank). Both columns are self-consistent: is computed from the remaining stage duty after aero credit.
Peak lateral is the instantaneous load at exit, decaying to 37% within 2.5 seconds () as the vehicle climbs into thinner air. These are brief pulses, not sustained loads.
G-load constraints and optimal exit altitude. The peak lateral acceleration at exit is:
Setting this equal to a g-limit and solving for the maximum density (minimum altitude):
| Payload class | -limit | Min exit altitude (conservative) | Min exit altitude (purpose-built) |
|---|---|---|---|
| Bulk cargo | 30 g | ~14 km | ~17 km |
| Rugged cargo | 20 g | ~16 km | ~19 km |
| Sensitive cargo | 10 g | ~21 km | ~24 km |
| Human-rated at 3 km/s (brief 5g peak) | 5–7 g | ~24–26 km | ~27–29 km |
These g-limits apply to vehicles exiting at 3 km/s, where dynamic pressure is high (~401 kPa at 20 km). The constraint drives a reduced bank angle and modest aero delta-v. But the human-rated vehicle does not exit at 3 km/s.
The human vehicle exits at ~700 m/s. At that speed, exit dynamic pressure is only ~22 kPa, gentler than a rocket’s Max Q. The peak lateral g at full bank () is:
The vehicle banks at full authority with g-loads at level flight. The aero delta-v at full :
At lower exit velocity the aero delta-v is proportionally smaller. But the peak g is also lower, so the full bank angle is always available. A cargo vehicle from the same altitude at 3 km/s and full gets ~500 m/s. The speed multiplier dominates. The human savings come not from aerodynamics but from loss elimination: the vertical climb is electromagnetic, the exit is above 93% of the atmosphere, and the engine burns near-horizontal. The ~100 m/s of aero credit is a bonus, not the main story.
The optimal exit altitude is set by the terminal pylon, not the aerodynamics. For both cargo and human-rated vehicles, the aero delta-v formula says “go as low as possible.” The binding constraint is structural: the height of tension-stabilised mast you can build from a given summit.
| Summit altitude | Pylon height | Exit altitude | Aero (cargo 3 km/s, purpose-built) | Aero (human 700 m/s, full bank) | Human peak g |
|---|---|---|---|---|---|
| 5 km | 10 km | 15 km | 1,097 m/s | ~230 m/s | ~2.2 g |
| 5 km | 15 km | 20 km | 501 m/s | ~105 m/s | ~1.0 g |
| 8 km | 12 km | 20 km | ~500 m/s | ~105 m/s | ~1.0 g |
| 8 km | 10 km | 18 km | 686 m/s | ~143 m/s | ~1.4 g |
| 8 km | 15 km | 23 km | 310 m/s | ~65 m/s | ~0.7 g |
At 700 m/s, the human-rated vehicle banks at full authority everywhere. No g-limit is binding. Lower altitude gives the human vehicle more free delta-v (230 m/s at 15 km vs 105 m/s at 20 km). The peak g-loads remain gentle throughout (under 3 g even at 15 km). For cargo at 3 km/s, lower altitude is even better: a 10 km pylon on a 5 km summit (15 km exit) yields over a kilometre per second of free horizontal delta-v, though at 44 g peak.
Propellant savings across the design envelope. For hydrolox ( = 465 s, 100 t post-burn mass):
| Exit altitude | Aero (cargo) | Engine duty | Mass ratio | Propellant (t) | Savings vs 9.2 km/s kerolox |
|---|---|---|---|---|---|
| 30 km (launcher only) | ~0 | 7.7 km/s | 5.41 | 441 | 59% |
| 25 km | ~220 m/s | 7.5 km/s | 5.18 | 418 | 61% |
| 20 km | ~500 m/s | 7.2 km/s | 4.84 | 385 | 64% |
| 18 km | ~690 m/s | 7.0 km/s | 4.64 | 364 | 66% |
| 15 km | ~1,100 m/s | 6.6 km/s | 4.27 | 327 | 70% |
For NTP ( = 900 s):
| Exit altitude | Aero (cargo) | Engine duty | Mass ratio | Propellant (t) | Savings vs 9.2 km/s kerolox |
|---|---|---|---|---|---|
| 30 km (launcher only) | ~0 | 7.7 km/s | 2.40 | 140 | 87% |
| 20 km | ~500 m/s | 7.2 km/s | 2.26 | 126 | 88% |
| 15 km | ~1,100 m/s | 6.6 km/s | 2.12 | 112 | 90% |
Drag penalty. At , drag costs about half the lift impulse from the vertical velocity budget. But the vehicle has ~3 km/s vertical and needs only ~500–700 m/s residual. Even at 1,100 m/s of aero delta-v with drag loss of ~550 m/s, the vehicle retains ~2,375 m/s vertical after drag and gravity losses.
The vertical budget is never the binding constraint. In a rocket, drag opposes the direction of travel and is pure loss. Here the vehicle is climbing nearly vertically into thinning air. Drag bleeds surplus climb that would otherwise be wasted on overshoot, while the same aerodynamic force, projected horizontally as lift, builds wanted orbital velocity. The vehicle’s planform is sized for runway landing and horizontal banking, not for minimum drag. The design envelope that makes reuse possible is the same one that makes the turn productive.
Reference design summary. For an 8 km summit with a 12 km tension-stabilised pylon (20 km exit), 50 t payload:
| Vehicle class | Peak g in curve | Exit velocity | Aero Δv | Engine duty (hydrolox) | Propellant per 100 t | Savings |
|---|---|---|---|---|---|---|
| Human-rated | 7 g | 700 m/s | ~105 m/s | 7.8 km/s | 453 t | 58% |
| Sensitive cargo (electronics, optics) | 15 g | ~1.1 km/s | ~165 m/s | 7.6 km/s | 430 t | 60% |
| Standard cargo (machinery, tanks) | 30 g | ~1.6 km/s | ~240 m/s | 7.5 km/s | 418 t | 61% |
| Ruggedised cargo (bulk metal, water) | 50 g | ~2.1 km/s | ~315 m/s | 7.4 km/s | 407 t | 62% |
| Hardened cargo (aggregate, probes) | 100 g | ~3.0 km/s | ~500 m/s | 7.2 km/s | 385 t | 64% |
All five classes use the same tunnel, the same pylon, the same exit altitude, the same vacuum. The ~30 km bore (12 km linear + 18 km curvilinear toward vertical) serves every vehicle class. The coils run a different acceleration programme for each manifest. The software decides how hard to push based on what is in the cradle. The curve that gives humans a roller-coaster (7 g) gives bulk cargo 50 g and hardened freight 100 g. One tunnel, one pylon, N programmes.
The Pythagorean Dividend. The aerodynamic turn is nearly free because velocity components add in quadrature: . Converting a vertical vector into a horizontal one at high speed costs almost nothing in total speed because the horizontal component you gain is squared before it contributes. The vertical component you surrender is subtracted from a much larger squared number.
| Case | Initial vertical | Aero Δv gained | Vertical after bank | Apogee tax | Tax (%) |
|---|---|---|---|---|---|
| Cargo (3 km/s exit) | 3,000 m/s | 500 m/s | m/s | 42 m/s | 1.4% |
| Human (700 m/s exit) | 700 m/s | 100 m/s | m/s | 7 m/s | 1.0% |
Meridian deliberately oversupplies vertical velocity so the bank can exploit this asymmetry. The 3 km/s throw is far more than Halcyon needs to reach apogee. Halcyon can trade the surplus. Stealing 500 m/s horizontal for 42 m/s vertical is the point.
Why 700 m/s for humans. The curvilinear section’s turn radius scales as . At human summit velocity (852 m/s) and 5 g centripetal, the radius is 15 km. The same curve that gives humans a roller-coaster (5–7 g) gives cargo at 3 km/s a ~60–90 g ride. Both fit through the same bore. The lower exit speed means gentler dynamic pressure (22 kPa vs 401 kPa) and a propellant penalty of 68 t: 453 t vs 385 t per 100 t delivered, or 58% vs 64% savings. The 58% comes not from the aerodynamic turn but from loss elimination: the vertical climb is electromagnetic and the exit is above 93% of the atmosphere regardless of exit speed.
The deeper point. The ideal exit altitude is not “as high as possible to escape the atmosphere.” It is as low as the pylon can reach because the residual atmosphere is a resource to be harvested. Every additional metre of air the vehicle flies through is free horizontal momentum the engine does not have to provide. The launcher oversupplies vertical velocity on purpose. That surplus buys altitude (atmosphere bypass), time (vacuum burn window), and—via the lifting body—free orbital velocity. Electricity provides the kinetic energy. Thin air provides the turn. Vacuum provides the burn. Nothing is wasted.
C3. Cargo Structural and Thermal Survivability at Exit
The cargo reference design exits at 3 km/s, 20 km altitude, Mach ~10. Dynamic pressure is 401 kPa—roughly 10× a rocket’s Max Q. The question is whether the structural and thermal load is survivable. The analysis below shows it is, and by a wider margin than intuition suggests.
Reference vehicle. 50 t payload, 10% dry fraction, hydrolox propellant for 7.2 km/s engine duty. Total mass at exit t. Planform m² (~31 m × 16 m) set by runway landing wing loading.
1. Aerodynamic Loads
Speed of sound at 20 km: m/s. Mach number at exit: .
Dynamic pressure: kPa.
Stagnation (total) pressure at the nose: Using the normal-shock Rayleigh Pitot formula at :
For comparison: a scuba cylinder is rated at 200–300 bar. A fire extinguisher at 12–15 bar. The 7.1 bar stagnation pressure at the nose is within the range of ordinary pressure vessels. The challenge is thermal, not mechanical.
Force decomposition during the aero bank (, ):
- Lift (centripetal): MN →
- Drag (axial deceleration): MN →
- Combined load vector: peak
Duration. The aerodynamic forces decay exponentially as the vehicle climbs into thinning air. The e-folding time is s.
| Time after exit | Force as % of peak | Cumulative impulse |
|---|---|---|
| 0 s | 100% | 0% |
| 1.7 s | 50% | 50% |
| 2.5 s | 37% | 63% |
| 5.0 s | 14% | 86% |
| 7.5 s | 5% | 95% |
Above 50% peak force lasts 1.7 seconds. 95% of total aerodynamic impulse is delivered within 7.5 seconds. The structural pulse is brief and well-characterised, not a sustained load.
2. Thermal Loading
Using the Sutton-Graves stagnation-point heat-flux approximation with nose radius m:
Since density decays as , heating rate decays as . Integrating:
Comparison to known re-entry systems:
| Event | Peak heat flux | Duration | Total heat load |
|---|---|---|---|
| Cargo exit (3 km/s, 20 km) | 1.47 MW/m² | ~5 s effective | 7.4 MJ/m² |
| Shuttle re-entry (orbital) | ~500 kW/m² | ~1,200 s | ~600 MJ/m² |
| Dragon re-entry (orbital, PICA-X) | ~3–5 MW/m² | ~300–500 s | ~1,500 MJ/m² |
| Apollo lunar re-entry | ~50 MW/m² | ~200 s | ~10,000 MJ/m² |
The cargo exit total heat load is ~200× less than Dragon’s re-entry. Dragon’s PICA-X heat shield absorbs ~1,500 MJ/m². The cargo vehicle nose needs a few millimetres of ablator (graphite or PICA) to absorb 7.4 MJ/m². The rest of the vehicle surface sees roughly 10–30% of stagnation heating, reducing the average body heat load to ~0.7–2.2 MJ/m²—manageable with standard aerothermal coatings.
3. Structural Analysis
Wing root bending (dominant structural load). Lift of 98.2 MN acts across half the span (~8 m average moment arm). Bending moment at wing root:
For a realistic CFRP wing-root box beam (root chord 16 m, thickness ratio 7%, structural material 25% of cross-section, m to neutral axis):
CFRP allowable in bending: 800–1,500 MPa. Margin: 10–19×. Even at 100 g for hardened cargo, bending stress remains below 380 MPa—still within standard CFRP allowable with margin.
Acoustic environment. An attached turbulent boundary layer at Mach 10 generates surface pressure fluctuations of ~0.5–1% of dynamic pressure (RMS). At kPa, RMS fluctuation ~2–4 kPa → ~160–166 dB OASPL for ~3 seconds. This matches the acoustic environment at rocket Max Q (Falcon 9: ~160 dB; Shuttle: ~162 dB) and is within the qualification envelope of military-rated avionics. Duration is 3 seconds vs a rocket’s sustained Max Q. Fatigue cycles are negligible.
4. Integrated Stress Comparison: Exit vs Re-entry
The cargo vehicle’s full exit+bank event is structurally less severe than a routine orbital re-entry, and far less severe than the entry vehicles already deployed:
| Load | Cargo exit (3 km/s, 20 km) | Dragon orbital re-entry | Ratio |
|---|---|---|---|
| Peak g | ~23 g | ~4–6 g sustained (longer) | — |
| Total aero impulse | ~570 m/s equivalent | ~7,800 m/s equivalent | ~14× less |
| Peak heat flux | 1.47 MW/m² | 3–5 MW/m² | 2–3× less |
| Total heat load (stag) | 7.4 MJ/m² | ~1,500 MJ/m² | 200× less |
| Acoustic duration at ~160 dB | ~3 s | ~0 s (no acoustic pulse on re-entry) | — |
| Wing root bending stress | ~78 MPa | Governed by landing | CFRP margin 10× |
The cargo exit has higher peak g than a capsule re-entry. But the total impulse is fourteen times smaller, the heat load is two hundred times smaller, and the duration is seconds rather than minutes. The vehicle faces a brief intense pulse, not a prolonged ordeal.
5. Design Requirements Summary
For a ruggedised cargo lifting body (≤30 g class, standard cargo):
- Nose TPS: Light ablative cap, ~5–10 mm PICA or graphite. Absorbs 7.4 MJ/m² at stagnation. Off-the-shelf aerospace ablatives (AVCOAT, PICA, SLA-561) all qualify with margin.
- Wing structure: CFRP box-beam root, sized by landing loads (not exit loads). Exit bending at 23 g peak produces ~78 MPa vs 800+ MPa allowable—10× margin.
- Vehicle components: Qualified to ~160 dB, 30 g for 3 seconds. Standard military-spec avionics envelope. The cargo payload itself (bulk metal, propellant, water) requires no special treatment.
- Attitude control: Must maintain bank angle ±5° through the aero pulse. At 3 km/s and high dynamic pressure, control authority from aerodynamic surfaces is large. Small deflections produce large moments. This is a flight dynamics problem with well-characterised solutions.
- Hardened cargo (100 g class): At 100 g, bending stress reaches ~380 MPa—still within CFRP limits but requiring careful layup optimisation. Heat load unchanged (same altitude, same duration). Acoustic environment unchanged. These vehicles are functionally ICBM re-entry bodies in reverse: a well-understood engineering class.
The bottom line. The cargo vehicle does not face a novel structural or thermal challenge. It faces a brief, intense pulse—three seconds at a load that re-entry vehicles are already designed to exceed in magnitude and dwarf in duration. The nose needs an ablative cap measured in millimetres. The structure needs no special provision beyond what runway landing already demands. The acoustic environment is matched by existing military-qualified hardware. The engineering constraints are real but conventional.
D. Rocket Equation Mass Savings
Lower exit altitude, or shorter pylon, is simultaneously cheaper to build and more productive to operate.
The Tsiolkovsky equation: , where .
Mass ratio . Propellant fraction .
For a 100 t post-burn (dry + payload) mass. Normalisation note: all propellant figures in this appendix and the body tables are normalised to 100 t post-burn mass—the vehicle at orbital insertion after all propellant is spent. At 10% dry fraction, this is 90 t net payload + 10 t vehicle structure. To convert to “per tonne of net payload,” divide propellant by 0.9 (or by ). The distinction matters for logistics costing (Appendix K) but not for the savings percentages, which are ratios.
| Scenario | (km/s) | (s) | (km/s) | Mass ratio | Propellant (t) | Savings |
|---|---|---|---|---|---|---|
| All-rocket, kerolox | 9.2 | 380 | 3.73 | 11.8 | 1,081 | — |
| All-rocket, hydrolox | 9.2 | 465 | 4.56 | 7.5 | 653 | — |
| Launcher + aero (20 km human, 700 m/s) + hydrolox | 7.8 | 465 | 4.56 | 5.5 | 453 | 58% |
| Launcher only + hydrolox | 7.7 | 465 | 4.56 | 5.4 | 441 | 59% |
| Launcher + aero (25 km) + hydrolox | 7.5 | 465 | 4.56 | 5.2 | 418 | 61% |
| Launcher + aero (20 km cargo) + hydrolox | 7.2 | 465 | 4.56 | 4.8 | 385 | 64% |
| Launcher + aero (18 km) + hydrolox | 7.0 | 465 | 4.56 | 4.6 | 364 | 66% |
| Launcher + aero (15 km) + hydrolox | 6.6 | 465 | 4.56 | 4.3 | 327 | 70% |
| Launcher only + NTP | 7.7 | 900 | 8.83 | 2.4 | 140 | 87% |
| Launcher + aero (20 km cargo) + NTP | 7.2 | 900 | 8.83 | 2.3 | 127 | 88% |
| Launcher + aero (18 km) + NTP | 7.0 | 900 | 8.83 | 2.2 | 121 | 89% |
| Launcher + aero (15 km) + NTP | 6.6 | 900 | 8.83 | 2.1 | 112 | 90% |
All savings are vs the all-rocket kerolox baseline. Cargo “Aero” rows show the free horizontal delta-v gained from the aerodynamic bank manoeuvre at the indicated exit altitude, for a purpose-built cargo lifting body at 3 km/s exit (landing wing loading N/m², ; planform ~490 m² for a 50 t payload). The human-rated row is at 700 m/s exit from the same 20 km altitude, with ~105 m/s aero credit at full bank (, peak 1.0 g). The absolute vehicle mass cancels. See Appendix C2 for the derivation and g-load analysis.
Lower exit altitude is simultaneously cheaper to build and more productive to operate. The full savings decomposition is in Appendix D2.
D2. Savings Decomposition
The rocket equation punishes brute force exponentially; it rewards layered optimisation just as exponentially.
The 64% cargo propellant saving versus all-rocket kerolox has three distinct sources. They compound through the rocket equation but can be separated:
| Step | Change | Isp (s) | Δv (km/s) | Propellant (t) | Incremental saving |
|---|---|---|---|---|---|
| Baseline: all-rocket kerolox | — | 380 | 9.2 | 1,081 | — |
| 1. Switch to vacuum hydrolox | Isp 380→465 | 465 | 9.2 | 653 | 428 t (61% of total) |
| 2. Eliminate losses | Δv 9.2→7.7 | 465 | 7.7 | 441 | 212 t (30% of total) |
| 3. Aerodynamic turn | Δv 7.7→7.2 | 465 | 7.2 | 385 | 56 t (8% of total) |
The Isp switch is the largest single factor. Replacing sea-level kerolox with vacuum hydrolox contributes 61% of the total propellant saving. The launcher enables this switch by removing the atmospheric constraints that force ground-launched vehicles toward dense propellants. Loss elimination contributes 30%. The aerodynamic turn, despite being the most novel element, contributes 8%.
Why the layers compound. The rocket equation is . The exponent is . The Bridge attacks both sides of that fraction simultaneously:
- Numerator (reduce ): loss elimination removes ~1.5 km/s; the aerodynamic turn harvests another 100–500 m/s. Both are free, paid for by electricity and thin air.
- Denominator (increase ): the Isp switch from sea-level kerolox ( = 3,728 m/s) to vacuum hydrolox ( = 4,562 m/s) raises exhaust velocity by 22%.
The baseline exponent is . After all three layers: . That is a 36% reduction in the exponent, but because it is an exponent, the mass ratio drops from 11.8 to 4.85, a 59% reduction in propellant. In a linear system, shrinking the budget by 22% and improving the engine by 22% would save roughly 40%. Through the exponential, the same improvements save 64%. Each layer amplifies the others because they all feed through the same nonlinearity. The rocket equation punishes brute force exponentially; it rewards layered optimisation just as exponentially.
Comparison across propellants at the reference design (20 km exit, cargo):
| Propellant | Sea-level Isp (s) | Vacuum Isp (s) | Propellant at 7.2 km/s duty (t) | Savings vs kerolox baseline |
|---|---|---|---|---|
| Kerolox (RP-1/LOX) | ~282 | ~348 | 724 | 33% |
| Methalox (CH₄/LOX) | ~327 | ~363 | 655 | 39% |
| Hydrolox (H₂/LOX) | ~366 | ~465 | 385 | 64% |
| NTP (H₂ expander) | — | ~900 | 126 | 88% |
Methalox and kerolox perform similarly in vacuum (348 vs 363 s—only 4% difference). Their ground-launched advantages—higher density, smaller tanks, less drag—are irrelevant when the vehicle starts at 28 km in vacuum. Hydrolox at 465 s[6][19] is 28% better than methalox. Through the exponential, that gap nearly halves the propellant (655→385 t). The planform that earns the aerodynamic turn provides exactly the volume hydrogen’s low density requires: the tanks are the wing, and both constraints point to the same design.
E. Launcher Acceleration and Path Length
The mountain provides the structure; the bore provides the path.
Required acceleration track length:
| Exit speed | 3 g (human ref) | 5 g (crew peak) | 10 g (cargo gentle) | 20 g (cargo ref) | 30 g (cargo max) |
|---|---|---|---|---|---|
| 1.5 km/s | 38.2 km | 22.9 km | 11.5 km | 5.7 km | 3.8 km |
| 2.0 km/s | 68.0 km | 40.8 km | 20.4 km | 10.2 km | 6.8 km |
| 2.5 km/s | 106.2 km | 63.7 km | 31.9 km | 15.9 km | 10.6 km |
| 3.0 km/s | 153.0 km | 91.8 km | 45.9 km | 23.0 km | 15.3 km |
The reference bore is ~30 km: 12 km linear + 18 km curvilinear toward vertical. Both cargo and human flights use the same bore. Crew at 3 g sustained reach ~850 m/s summit velocity (700 m/s at pylon exit after gravity losses), navigating the curvilinear section at 5–7 g centripetal. Cargo at 20+ g sustained accelerates through both sections, reaching up to 3 km/s. The shared curve produces ~30–50 g centripetal at ruggedised-cargo speeds (~2 km/s) and ~85–90 g at the full 3 km/s, within the 100 g hardened-cargo rating (Appendix C2).
This is achievable with standard bedrock-tunnel engineering. For comparison, the Gotthard Base Tunnel is 57 km long through the Alps. The 30 km bore is well within this range. The structural challenge is maintaining vacuum, alignment, and electromagnetic coil precision, not length itself. The mountain provides the structure; the bore provides the path.
Vacuum loading is structurally trivial. An evacuated tunnel must resist atmospheric pressure on its walls: ~101 kPa (14.7 psi). Lithostatic pressure from rock overburden grows at roughly 23 kPa per metre of depth (assuming ~2,300 kg/m³ rock density). At just 5 metres of overburden, rock pressure already exceeds atmospheric pressure. At the Gotthard Base Tunnel’s maximum overburden of 2,300 m, the rock stress is roughly 50 MPa, over 500 times atmospheric. The Gotthard engineers contended with squeezing rock conditions causing 0.5–0.7 m of tunnel convergence under that pressure. By comparison, the 0.1 MPa of vacuum loading is a rounding error. Any tunnel lining competent to withstand rock overburden in a mountain range automatically contains vacuum.
The harder structural requirements are electromagnetic: maintaining coil alignment to millimetre precision over tens of kilometres, managing thermal cycling from pulsed multi-gigawatt discharge, and ensuring vacuum seal integrity at joints and transitions. These are precision engineering challenges, not structural strength challenges. The mountain handles strength. The engineering handles precision.
Curvilinear section. Near the summit, the tunnel curves from its bore angle toward near-vertical alignment with the pylon. In this section, the electromagnetic coils maintain velocity against gravity (~1 g of deceleration at near-vertical orientation) but do not add speed. The dominant force the payload experiences is centripetal, from the curved path. The turn radius scales as , which makes exit velocity the dominant variable:
| Vehicle | Summit velocity | Centripetal g | Turn radius | Arc for 70° turn | Arc for 10° turn |
|---|---|---|---|---|---|
| Cargo | 3,039 m/s | 20 g | 47 km | ~57 km | ~8 km |
| Cargo | 3,039 m/s | 30 g | 31 km | ~38 km | ~5 km |
| Human | 852 m/s | 5 g | 15 km | ~18 km | — |
| Human | 852 m/s | 7 g | 10 km | ~13 km | — |
Both vehicle classes use the same ~30 km bore: 12 km linear + 18 km curvilinear (70° turn toward vertical). The curve is a graduated clothoid—gentle at the start, tighter near the summit. Humans navigate it at 852 m/s with 3–7 g centripetal (7 g for under 3 seconds, ~21 seconds total). Cargo traverses the same curve at higher speed: ~30–50 g centripetal at ruggedised speeds, rising to ~85–90 g at the full 3 km/s, within the 100 g hardened-cargo rating. The coils provide different programmes: maintain-velocity-only for humans in the curve, sustained acceleration for cargo throughout. One bore, two acceleration profiles.
Load distribution in the curve. The vehicle does not sit on rails. It rides inside a cylindrical electromagnetic cradle: a 360° magnetic suspension that distributes centripetal force omnidirectionally around the hull. At 50 g, a 500-tonne cargo vehicle has an apparent weight of ~25,000 tonnes. Concentrated on a chassis, that would require massive reinforcement. Distributed uniformly around a cylindrical shell, it becomes like the hoop stress of a deep-sea vessel.
Composite cylinders are exceptionally strong under uniform compression. A lightweight CFRP shell that would buckle under a point load survives the distributed pressure with margin. The mountain absorbs the reaction (bending moment from the curved track transfers into bedrock through the tunnel lining). The cradle converts a structural impossibility into a solved engineering problem: uniform compression of a rigid shell.
Terminal pylon. The terminal structure above the summit adds 10–15 km of vertical height and carries zero acceleration load. Both cargo and human vehicles exit the same bore and coast through the same pylon, but the gravity loss during transit differs. Cargo at ~3 km/s loses ~39 m/s over ~4 seconds. The human vehicle at ~852 m/s loses ~152 m/s over ~16 seconds, arriving at the top at ~700 m/s. This is why the tunnel accelerates humans to ~850 m/s rather than 700 m/s: it pre-loads the gravity tax. The pylon is purely a vacuum-containment and altitude-extension structure. All acceleration is done inside the mountain, where bedrock absorbs the reaction forces. The pylon never has to resist the forces of launching a vehicle. It only has to stand up and hold vacuum.
Passenger seat orientation: phase-by-phase. The human body’s tolerance to acceleration is strongly axis-dependent. Longitudinal Gs acting head-to-toe (+G) drain blood from the brain; the onset of G-induced loss of consciousness (G-LOC) occurs around 5–6 g. Transverse Gs acting chest-to-back (+G, “eyeballs-in”) keep blood at the same hydrostatic level as the heart and brain; humans remain conscious and functional up to 10–15 g in this orientation.[20] Every crewed vehicle design—from Mercury to Dragon—exploits this by seating astronauts supine relative to the thrust axis, turning what would be a blackout into a heavy but survivable sensation.
The Bridge vehicle faces a complication standard rockets do not: the dominant force vector rotates through roughly 70° over the first two minutes, from longitudinal (linear bore) to centripetal (curvilinear section) and back. The solution is fully articulating seats that track the shifting vector continuously.
| Phase | Duration | Peak g | Force axis | Seat position |
|---|---|---|---|---|
| Linear bore | ~29 s | 3 g | Longitudinal (forward) | Reclined ~15–20° from horizontal; force is +G |
| Curvilinear section | ~21 s | 7 g (3 s) | Centripetal (radially inward) | Seats pivot to flat; centripetal load acts chest-to-back, +G |
| Pylon coast | ~16 s | ~0 g | None | Seats return upright |
| Aerodynamic bank | ~11 s | ~1 g | Lateral (banking) | Upright; barely perceptible roll, like a commercial turn |
| Engine burn (0.9–5 g) | ~7 min | 5 g | Longitudinal (rearward) | Reclined again; seats tilt further as acceleration builds to 5 g at burnout |
| Re-entry glide | ~30 min | ~1.5 g | Longitudinal (braking) | Standard seated posture; spaceplane deceleration well within comfort envelope |
The critical transition is entering the curve. Without the seat pivot, 7 g centripetal acting straight down the spine would cause immediate G-LOC. With the pivot—seats rotating backward as the track curves, so that passengers end up lying flat on their backs—the same force presses uniformly across the full dorsal surface. The peak feels like a heavy weight on the chest for three seconds, then eases. The requirement is a pivot mechanism that tracks the local g-vector in real time. This is well-understood actuation engineering, similar in principle to reclining systems used in centrifuge training seats and fighter-pilot couch concepts. The seat need not be exotic. The physics argument is that the axis matters more than the magnitude.
F. Terminal Structure Materials
The terminal pylon remains the weakest engineering link in the architecture.
Carbon nanotube composites are the enabling material for the terminal pylon. The key distinction is between tensile and compressive behaviour:
| Property | Value | Source |
|---|---|---|
| CNT fibre tensile strength (macro-scale) | 4–7 GPa typical; up to 14 GPa demonstrated | Peng et al. (2008),[21] recent macro-fibre results |
| CNT fibre compressive strength | ~416 MPa (pure), ~573 MPa (epoxy-infiltrated) | Literature survey |
| Specific tensile strength | ~46,000 kN·m/kg (theoretical individual tube) | |
| Carbon fibre (T1000G) tensile strength | 6.4 GPa | Commercial reference |
| High-strength steel tensile | 1.0–2.0 GPa | |
| Kevlar 49 tensile | 3.0 GPa |
The order-of-magnitude disparity between CNT tensile and compressive strength drives the architecture toward a tension-stabilised stayed mast rather than a compression tower. In this design:
- The central mast carries modest compression (its own weight only: payloads coast through at exit velocity with no acceleration forces transmitted to the structure)
- A wide network of guy cables, anchored to bedrock kilometres from the base, carries the dominant structural loads in tension
- The mast can be slender because the cables prevent buckling and there are no launch reaction forces
This is the same structural principle as a guyed radio mast, which routinely reaches 600+ m with far weaker materials. Scaling to 10–20 km above a mountain summit requires centurial-grade CNT composites, but the type of structure is well understood.
Honest caveat. Macro-scale CNT fibres demonstrating multi-gigapascal tensile strength exist, and the structural type (tension-stabilised mast) is directionally consistent with how those fibres perform best. But there is still a large gap between “strong fibres exist” and “a 10–20 km precision-aligned, vacuum-integrated terminal is a credible structure with known dynamic margins.” The essay treats this as a centurial-project challenge, solved over decades of materials engineering and iterative construction, not as a near-term capability. If the terminal proves harder than expected, the architecture degrades to lower exit altitudes (a 5–8 km terminal still buys most of the atmospheric bypass) rather than failing entirely.
Wind loading at stratospheric altitude is far lower than at sea level. Dynamic pressure scales with density, and at 20–30 km altitude, air density is 1–4% of surface values. The dominant concern shifts from wind to thermal cycling, alignment maintenance under differential solar heating, and vacuum seal integrity.
F2. Phase Zero: Angled Exit Without Pylon
The pylon is the hardest component in the architecture. It is also not required for first operations.
For ruggedised bulk cargo—raw materials, propellant feedstock, structural mass, water—a launcher can exit directly from the mountainside at a steep angle (45–60° from horizontal), skipping the pylon entirely. At the extreme end, expendable probes at 50–100 g need only 5–10 km of tunnel and can tolerate the full atmospheric exit pulse. The tunnel is the only major infrastructure: bored mostly horizontal through the mountain for the acceleration phase, curving to the exit angle in the final kilometres.
The air is denser and more useful. At an 8 km summit exit with no pylon, air density is ~0.53 kg/m³ (43% of sea level). Dynamic pressure at 3 km/s is roughly 2,400 kPa, about 6× the 20 km reference case. The structural pulse is fierce but brief (~2.5 s time constant). For ruggedised cargo at 30 g peak tolerance, the aerodynamic turn harvests ~735 m/s of free horizontal delta-v, more than the 500 m/s available at 20 km with 20 g. At 100 g, the aero turn yields ~2,450 m/s. At that loading, though, the vehicle is closer to a ballistic shell than a lifting body. The aero delta-v formula starts to break down as the turn becomes a large fraction of total velocity.
The angled exit adds a horizontal head start. At 60° from horizontal, the vehicle exits with ~1,500 m/s horizontal and ~2,600 m/s vertical. At 45°, the split is ~2,120 / 2,120. The vehicle is already partway to orbit before the bank begins. Combined with the aero turn, the engine’s residual duty drops further.
Tunnel length scales inversely with g-tolerance. This is the expendable-probe argument. At 100 g and 3 km/s, the tunnel is ~4.6 km, a fraction of the Gotthard. At 50 g: ~9.2 km. At 30 g: ~15.3 km. For disposable shells carrying bulk mass (water, metal stock, shielding aggregate), the vehicle cost is minimal and the tunnel is short. The economics resemble artillery logistics more than aerospace: cheap rounds, expensive gun, fire often.
| Configuration | Tunnel g | Tunnel length | Exit altitude | Aero Δv | Vehicle type | Pylon |
|---|---|---|---|---|---|---|
| Expendable probe (100 g) | 100 g | ~4.6 km | ~8 km | ~2,450 m/s | Disposable shell | No |
| Expendable probe (50 g) | 50 g | ~9.2 km | ~8 km | ~1,225 m/s | Disposable shell | No |
| Ruggedised drone (30 g) | 30 g | ~15.3 km | ~8 km | ~735 m/s | Reusable drone-bus | No |
| Reference cargo (20+ g, 3 km/s) | 20+ g | ~30 km (shared) | 20 km | ~500 m/s | Reusable lifting body | Yes (12 km) |
| Reference human (3 g, 700 m/s) | 3 g | ~30 km (shared) | 20 km | ~105 m/s | Crewed space-plane | Yes (12 km) |
What the pylon adds, and why it still matters. The pylon is not just for humans. Exiting at 20 km rather than 8 km reduces peak dynamic pressure by 6×, which matters for any cargo that cannot tolerate 2,400 kPa: electronics, optical systems, biological payloads, precision instruments. The full architecture serves all cargo classes; the pylon-free variant serves only the ruggedised end of the spectrum. But that end is where most of the mass lives in the early decades: water, metal, propellant, shielding. The tonnes that justify the infrastructure are bulk tonnes.
The bootstrap path. Phase Zero’s tunnel becomes a permanent bulk-freight bore. When the pylon is eventually added to the same mountain, the angled exit remains in service for ruggedised mass while the vertical exit serves the full range of cargo classes and human transit. Nothing is discarded. Each generation of infrastructure becomes the foundation for the next.
The pylon unlocks the full system. The tunnel alone is enough to start.
G. Throughput and Energy Economics
The constraint on throughput is not energy. It is the mechanical, thermal, and logistical limits of the launcher and its orbital receiving infrastructure.
Energy per shot. For total launched mass (post-burn mass plus propellant) at exit velocity :
| Post-burn mass | Propellant | Total launched mass | = 3 km/s | Energy per shot |
|---|---|---|---|---|
| 100 t | ~441 t (hydrolox, 7.7 km/s) | ~541 t | 3 km/s | 2.44 TJ (0.68 GWh) |
| 100 t | ~139 t (NTP, 7.7 km/s) | ~239 t | 3 km/s | 1.08 TJ (0.30 GWh) |
Real launcher efficiency includes magnetic coil losses, power conditioning, and thermal management. Assume 60–70% wall-plug-to-kinetic efficiency. The table uses the conservative 60% figure. At 70%, gross energy per shot falls by roughly one-seventh. Gross energy per shot:
| Case | Gross energy per shot | At daily cadence | At 6-hour cadence |
|---|---|---|---|
| Hydrolox | ~1.13 GWh | ~47 MW avg | ~188 MW avg |
| NTP | ~0.50 GWh | ~21 MW avg | ~83 MW avg |
Peak vs average power. A 3 km/s exit at 20 g means the acceleration phase lasts ~15 seconds. Delivering 2.44 TJ in 15 seconds requires ~160 GW average instantaneous, far beyond any continuous source. The solution is energy storage: flywheels, superconducting magnetic energy storage, or capacitor banks charged over hours from the grid, discharged in seconds through the coils. This is standard pulsed-power engineering, used in particle accelerators and electromagnetic launch research at smaller scales.[22][23] The U.S. Navy’s EMALS uses exactly this architecture—stored kinetic energy, solid-state power conversion, linear motor—to launch aircraft from carrier decks at controlled acceleration profiles.[24]
Annual throughput comparison.
| Cadence | Annual upmass | Total energy (throw + propellant) | Context |
|---|---|---|---|
| Daily | 36,500 t/yr | ~0.01% of world electricity | ~17× 2024 world upmass |
| 6-hourly | 146,000 t/yr | ~0.03% | ~67× 2024 world upmass |
| Hourly | 876,000 t/yr | ~0.2% | ~403× 2024 world upmass |
Even at the most aggressive cadence, one shot per hour, total energy demand including propellant synthesis is under 0.2% of global electricity production (~ J/year).[25]
H. Lunar Export Energetics
Lunar regolith excels at what space construction needs most: the heavy, voluminous bulk materials that dominate construction tonnage and cost a fortune to lift from Earth.
Gravity well comparison.
| Body | Surface gravity | Escape velocity | Specific energy to escape (MJ/kg) |
|---|---|---|---|
| Earth | 9.81 m/s² | 11.2 km/s | 62.7 |
| Moon | 1.62 m/s² | 2.38 km/s | 2.83 |
Ratio: lunar escape energy is ~4.5% of Earth’s. For transport to high Earth orbit (not full escape), the advantage is even larger because the Moon has no atmospheric drag penalty. The 1986 National Commission on Space estimated lunar-to-high-Earth-orbit transport at less than 1/20th the energy of Earth-to-HEO for the same mass.[10]
Lunar mass driver sizing. For a 2.38 km/s exit velocity (lunar escape):
| Acceleration | Track length | Duration |
|---|---|---|
| 10 g | 29 km | 24 s |
| 20 g | 14.4 km | 12 s |
| 30 g | 9.6 km | 8 s |
These are modest lengths in the lunar context: no atmosphere, low gravity, stable regolith foundation. O’Neill’s original mass driver concepts proposed similar scales for lunar material export.[26]
Regolith composition (Apollo sample averages):[12]
| Element | Mass fraction | Primary use |
|---|---|---|
| Oxygen | ~45% | Propellant oxidiser, life support, water production |
| Silicon | ~21% | Solar cells, glass, ceramics |
| Aluminium | ~13% | Structural metal, conductors |
| Iron | ~8% | Structural steel, magnetic materials |
| Calcium | ~8% | Cement, ceramics |
| Magnesium | ~5% | Structural alloys |
| Titanium | ~1% | High-performance structural alloys |
The regolith table above makes this concrete: metals, glass, ceramics, oxygen, and radiation shielding are exactly the categories that dominate construction tonnage and cost a fortune to lift from Earth.
I. Environmental Comparison
The problem with scaling chemical rocketry. NOAA research (2022) found that a projected 10× increase in hydrocarbon-fuelled launches would cause meaningful damage to the stratospheric ozone layer, primarily through injection of black carbon (soot) and reactive nitrogen species directly into the stratosphere.[3] NASA’s 2024 review found that launch and reentry particulate emissions could, by 2040, become comparable to the natural meteoritic background flux if launch activity continues its growth trajectory.[27]
These findings imply that scaling the current chemical launch paradigm cannot sustainably deliver a future requiring 10–100× more orbital mass throughput.
Launcher-assisted architecture comparison.
| Architecture | Lower-atmosphere combustion | Stratospheric black carbon | Ozone impact | Propellant waste in atmosphere |
|---|---|---|---|---|
| Kerolox all-rocket | Full stack | High (soot from RP-1) | Significant at scale | ~1,081 t per 100 t payload |
| Launcher + aero turn + hydrolox | Upper stage only, above ~25 km | Near zero (H₂/O₂ exhaust is water) | Low (water vapour, OH chemistry at scale) | ~385 t water vapour above ~25 km |
| Launcher + aero turn + NTP | Upper stage only, above ~25 km | Zero (no combustion) | Minimal (H₂ exhaust) | ~126 t hydrogen above ~25 km |
The electromagnetic launcher replaces the dirtiest part of ascent—first-stage combustion through dense atmosphere—with stationary electricity. The orbital stage still produces exhaust, but in thin air or vacuum. If hydrogen-fuelled, the exhaust is water vapour rather than soot, CO₂, and reactive species.
High-altitude water vapour injection is not zero-impact. Three mechanisms deserve acknowledgement:
Noctilucent cloud seeding. Water injected above ~80 km (the mesosphere) can nucleate polar mesospheric clouds. NASA directly observed Space Shuttle exhaust creating artificial noctilucent clouds. This is primarily an optical effect, not a serious climate driver, but it is a real and observable atmospheric perturbation.
Hydroxyl (OH) chemistry. Water vapour in the stratosphere photodissociates under UV to produce OH radicals, which participate in catalytic ozone destruction cycles. The effect is much smaller per molecule than halogen-based chemistry (HCl from solid rocket motors is far more damaging), but at high launch rates, stratospheric OH perturbation warrants quantitative modelling.
Residence time. Stratospheric water vapour has a longer residence time than tropospheric, on the order of months to years rather than days. Injecting water above ~25 km means it stays aloft long enough for cumulative effects to matter at industrial throughput.
The comparative picture remains strongly in the launcher-assisted architecture’s favour. Soot (black carbon) has an effective global warming potential roughly 500× CO₂ on a per-mass basis at injection altitude. And the propellant savings—63% for hydrolox with aerodynamic turn, 88% for NTP—mean total atmospheric injection mass is reduced by the same fractions even if launch frequency rises.
At the throughput levels discussed in this essay (tens of megatonnes of Earth-export per year), the cumulative water vapour burden remains small relative to natural stratospheric sources. At industrial scale—millions of tonnes per year—it becomes a legitimate atmospheric chemistry monitoring question, treated the same way any large industrial process is: measured, modelled, and managed.
For industrial-scale orbital freight— to tonnes per year—the launcher-assisted architecture is not merely “greener.” It is the only architecture compatible with high-cadence operations without large-scale stratospheric damage. The residual concern is water vapour chemistry, not carbon or ozone depletion. That is a tractable monitoring and management problem. Soot in the stratosphere is not.
J. Lunar Mass Driver Economics
Earth’s launcher solves the access problem for complexity cargo. The Moon’s launcher solves the mass supply problem for bulk construction.
Gravity well comparison.
The specific energy to reach escape velocity from a body is :
| Body | Escape velocity | Specific escape energy | Atmosphere drag penalty | Ratio vs Earth |
|---|---|---|---|---|
| Earth | 11.2 km/s | 62.7 MJ/kg | +significant | 1× (reference) |
| Moon | 2.38 km/s | 2.83 MJ/kg | none | ~22× shallower |
The 1986 National Commission on Space estimated lunar-to-high-Earth-orbit transport at less than 1/20th the energy of Earth-to-HEO for equivalent mass.[10] The factor of ~22 in specific escape energy understates the full advantage because Earth’s atmospheric drag penalty adds further energy cost on ascent, a penalty the Moon does not have.
Marginal energy cost of lunar launch.[11]
For a mass driver delivering payloads at 2.38 km/s (lunar escape), kinetic energy per kilogram:
Assuming 60–70% wall-plug-to-kinetic efficiency, wall-plug energy is ~1.12–1.31 kWh/kg. The table uses the 70% figure; at 60%, the costs below rise by roughly one-sixth. At industrial power prices:
| Power price | Energy cost per kg launched | Cost per tonne |
|---|---|---|
| $0.05/kWh (grid industrial) | $0.056/kg | $56/t |
| $0.03/kWh (cheap solar/nuclear) | $0.034/kg | $34/t |
| $0.01/kWh (future lunar solar) | $0.011/kg | $11/t |
These costs are for the energy alone. Infrastructure amortisation, operations, and payload processing add more. But at high throughput (millions of tonnes per year), infrastructure amortisation falls rapidly. The marginal operating cost of a mature lunar mass driver is dominated by power, which from polar crater-rim solar installations approaches zero after capital recovery.
Track length for lunar mass driver.
Using for km/s:
| Acceleration | Track length | Duration |
|---|---|---|
| 10 g | 28.8 km | 24.3 s |
| 20 g | 14.4 km | 12.1 s |
| 30 g | 9.6 km | 8.1 s |
| 50 g (bulk raw ore) | 5.8 km | 4.9 s |
These are modest civil-engineering scales on the lunar surface: no atmosphere, low seismic activity, stable regolith. The structural engineering is straightforward compared to the terrestrial launcher. No vacuum tube required (the Moon has essentially no atmosphere), no guyed terminal structure, no complex atmospheric exit. The lunar mass driver is a solved conceptual problem. Its challenges are manufacturing, deployment, and teleoperated maintenance at scale, not structural physics.
Polar solar power.
Crater rims near the lunar poles receive sunlight for 70–90% of the lunar year—near-continuous illumination from a body with no axial weather variation.[28] A polar mass driver site can draw from near-continuous solar power without battery storage requirements for most operations. Equatorial lunar sites get 14 days of light, then 14 of dark. The contrast drives site selection toward the poles, which also tend to have permanently shadowed craters nearby containing water ice for propellant production.
The two mass drivers compared.
| System | Exit velocity | Track length | Atmosphere | Power source | Energy cost/kg |
|---|---|---|---|---|---|
| Terrestrial launcher | 3.0 km/s (assist) | ~30 km (shared bore) | Dense—requires vacuum tube + terminal | Grid + pulsed storage | ~$3–8/kg (electricity only) |
| Lunar mass driver | 2.38 km/s (escape) | ~14 km (20g) | None | Polar solar (near-continuous) | ~$0.03–0.06/kg |
The lunar mass driver is roughly 50–100× cheaper per kilogram in energy cost alone, and simpler to engineer. Together the two define a complete logistics architecture for a space civilisation: each doing the job it is suited for, neither asked to do the job it cannot.
K. Bridge Vehicle Economics and Cost per Kilogram
Energy is less than 10% of the total delivered cost. The physics floor is not the constraint.
Mass economics. For a reusable hydrolox bridge vehicle doing ~7.7 km/s after launcher handoff, the rocket equation gives mass ratio . The ratio of total launched mass to delivered payload depends critically on the vehicle’s dry-mass fraction :
| Dry fraction | Mass ratio | Launched mass per t delivered | Notes |
|---|---|---|---|
| 8% (aggressive drone-bus) | 5.4 | 9.5 t/t | Minimal structure, no crew systems |
| 10% (lean drone-bus) | 5.4 | 11.8 t/t | Reference cargo vehicle |
| 12% (robust drone-bus) | 5.4 | 15.4 t/t | Heavier TPS, wider margins |
| 15% (human-rated shuttle) | 5.4 | 28.7 t/t | Life support, redundancy, runway landing gear |
The human-rated variant pays a steep mass penalty. That is why the architecture separates crew and cargo vehicles. The drone-bus hauls tonnage. The crewed shuttle carries people and delicate cargo at lower cadence and higher per-flight cost.
Energy cost floor. Per delivered tonne to LEO:
| Component | Energy (MWh/t) | Cost at $0.05/kWh | Cost at $0.03/kWh |
|---|---|---|---|
| Launcher electricity | 15–19 | $0.75–0.95/kg | $0.45–0.57/kg |
| H₂ electrolysis[29] | 85–111 | $4.25–5.55/kg | $2.55–3.33/kg |
| H₂ liquefaction[30] | 15–25 | $0.75–1.25/kg | $0.45–0.75/kg |
| Total energy | 115–155 | $5.75–7.75/kg | $3.45–4.65/kg |
Infrastructure amortisation. Using StarTram-class capex as an anchor (~$20–50B for a cargo-only facility):[22]
| Annual throughput | $20B facility (30-yr) | $50B facility (30-yr) |
|---|---|---|
| 100,000 t/yr | $6.7/kg | $16.7/kg |
| 300,000 t/yr | $2.2/kg | $5.6/kg |
At high throughput, launcher amortisation becomes a small fraction of total cost.
Dominant cost: the bridge vehicle. Vehicle capital recovery, TPS inspection and replacement, engine overhaul, ground handling, cryogenic loading, range operations, and labour dominate the mature cost structure. This is the layer where industrial process engineering—not physics—determines the final number.
Reuse count is decisive. A simple amortisation sensitivity for a 100 t net payload vehicle, ignoring financing:
| Vehicle build cost | 50 reuses | 100 reuses | 500 reuses | 2,000 reuses |
|---|---|---|---|---|
| $200M | $40/kg | $20/kg | $4/kg | $1/kg |
| $500M | $100/kg | $50/kg | $10/kg | $2.50/kg |
| $1B | $200/kg | $100/kg | $20/kg | $5/kg |
The design instinct—standard exterior, modular internals, fast turnaround—is the economic essence. Estimated band: $50–250/kg depending on reuse count, turnaround time, and operational maturity.
Total cost synthesis.
| Component | Estimated range ($/kg) |
|---|---|
| Energy (electricity + propellant) | $5–15 |
| Launcher amortisation | $5–30 |
| Bridge vehicle + operations | $50–250 |
| Total to LEO (first generation) | $100–300 |
| Mature operations (500+ reuses) | $20–80 |
| Long-run asymptote (2,000+ reuses) | $20–50 |
The first-generation band ($100–300/kg) reflects early fleet sizes, conservative reuse counts, and immature process engineering. It is the number to underwrite the first launcher on.
The mature band ($20–50/kg) requires the bridge vehicle to achieve locomotive-like durability: 500–2,000+ flights per airframe, days between turnarounds, and standardised maintenance. At that cadence, vehicle amortisation falls to $2–10/kg (see reuse table above), launcher amortisation is sub-$1/kg, and the dominant term becomes operations labour and consumables. This is in the range of intercontinental air freight today. That is the correct structural analogy for what the bridge becomes at scale. Not a space programme. A freight system.
Calibration note. The energy floor and amortisation arithmetic are grounded in cited inputs and straightforward accounting. The refurbishment and labour cost model is not: it is argued by analogy to high-cadence transport systems (airlines, container shipping) rather than derived from demonstrated bridge-vehicle operations. The $20–50/kg asymptote is a directional target supported by the cost structure, not a figure the current evidence stack fully earns. The conservative $100–300/kg first-generation band is the number to underwrite infrastructure decisions on.
L. Population and Industrial Migration
Cross-checked migration model incorporating a declining Earth-complexity burden as off-world industry matures. All figures are internally consistent scenario arithmetic, not forecasts. Earth population is assumed to follow the UN medium variant, peaking at approximately 10.4 billion in the 2080s and declining thereafter.[31] Physical constants verified against cited sources.
Verified constants.
- Lunar escape velocity: 2,376 m/s; specific launch energy MJ/kg = 0.784 kWh/kg.[9]
- Earth solar intercept: ~173,000 TW continuously.
- Hydrolox benchmark: RL10C-X at 460.9 s vacuum Isp, 5.5:1 O/F ratio.[19]
- DOE electrolysis: ~55.2 kWh/kg H₂; liquefaction: ~10–17.5 kWh/kg H₂.[29][30]
- Bridge energy floor: ~115–155 kWh/kg delivered to LEO (launcher electricity + electrolysis + liquefaction).
- NREL 2024 utility PV capacity factor: 21.4–34.0%.
Industrial pipeline (housing capacity at fixed 1.5 t/person).
| Year | Lunar export | Habitats/yr | New capacity/yr | Earth complexity (fixed 1.5 t/p) |
|---|---|---|---|---|
| 2070 | 0.5 Mt/yr | 2.2 | 22,000 | 33,000 t/yr |
| 2090 | 10 Mt/yr | 44 | 444,000 | 667,000 t/yr |
| 2100 | 50 Mt/yr | 222 | 2.22 M | 3.33 Mt/yr |
| 2120 | 200 Mt/yr | 889 | 8.89 M | 13.3 Mt/yr |
| 2150 | 500 Mt/yr | 2,222 | 22.2 M | 33.3 Mt/yr |
Under a fixed 1.5 t/person assumption, the reference Earth-launch ramp falls 1.67–3.33× short of matched flow by 2100–2150. That gap is real. The correct two-stage model dissolves it.
Two-stage decay: Earth-exported complexity per new resident.
The 1.5 t/person figure is a bootstrap-era number. As lunar and orbital industry matures, Earth’s per-capita export burden falls toward an irreducible floor of genuinely Earth-origin goods. Modelled as:
with t/person, t/person, Mt/yr, :
| Lunar export | Earth complexity per new resident |
|---|---|
| 10 Mt/yr | 1.46 t |
| 50 Mt/yr | 1.17 t |
| 200 Mt/yr | 0.58 t |
| 500 Mt/yr | 0.35 t |
Corrected Earth-export burden and match to the reference ramp.
Applying the decay curve to the housing completion rate:
| Year | Decayed Earth export needed | Reference launch ramp | Match ratio |
|---|---|---|---|
| 2090 | 0.65 Mt/yr | 0.75 Mt/yr | 1.15× (over) |
| 2100 | 2.61 Mt/yr | 2.0 Mt/yr | 0.77× |
| 2120 | 5.16 Mt/yr | 5.0 Mt/yr | 0.97× (near match) |
| 2150 | 7.84 Mt/yr | 10.0 Mt/yr | 1.28× (over) |
The reference ramp becomes almost exactly right by 2120: slightly behind in 2100, comfortably ahead by 2150. The apparent gap in the fixed-1.5-t model was an artefact of holding the bootstrap number constant into the orbital-industrial era.
Required launch lanes (decayed model).
At 876,000 t/yr per hourly-equivalent 100 t tube:
| Year | Earth export (decayed) | Hourly tubes needed |
|---|---|---|
| 2100 | 2.61 Mt/yr | ~3 |
| 2120 | 5.16 Mt/yr | ~6 |
| 2150 | 7.84 Mt/yr | ~9 |
Across 10–20 mountain megacomplexes, that is under 1 tube per site at 2100, under 1 at 2150. Airport-scale, not planetary impossibility.
Earth-side energy budget (decayed model).
At 115–155 kWh/kg delivered and decayed Earth export:
| Year | Earth export | Average power | Share of Earth’s intercepted solar |
|---|---|---|---|
| 2100 | 2.61 Mt/yr | 34–46 GW | 0.000020–0.000027% |
| 2120 | 5.16 Mt/yr | 67–91 GW | 0.000039–0.000053% |
| 2150 | 7.84 Mt/yr | 103–139 GW | 0.000060–0.000080% |
After grossing up for 25–30% PV conversion efficiency, the largest case (2150) requires roughly 0.3–0.65 TW of installed solar nameplate—large but firmly in “industrial district” territory, not “coat the Earth in panels” territory.
Moon-side energy budget (launch only).
Using at :
| Lunar export | Launch power only | Share of Moon’s intercepted solar (~12.9 PW) |
|---|---|---|
| 50 Mt/yr | 6.4 GW | 0.000050% |
| 200 Mt/yr | 25.6 GW | 0.000198% |
| 500 Mt/yr | 63.9 GW | 0.000495% |
Launch is energetically negligible. The real lunar power budget is dominated by processing: excavation, oxygen extraction, refining, casting. NASA prototype-era ISRU figures suggest hundreds of GW for full refining at – t/yr scale—still a tiny fraction of the Moon’s solar resource, but the hard industrial challenge.
Illustrative population trajectory (two-stage model).
Using decayed Earth-export burden, the reference launch ramp, 1.5%/yr natural off-world growth, and the habitat completion schedule. These are scenario outputs, not forecasts: they show what the logistics architecture permits given the assumed ramp rates, not what will happen.
| Year | Off-world population (scenario) |
|---|---|
| 2100 | ~16 million |
| 2120 | ~132 million |
| 2150 | ~780 million |
| ~2157 | ~1 billion |
| 2200 | ~3.3 billion |
These figures are internally consistent with the decay model and the essay’s throughput assumptions. The 2200 figure assumes lunar export continues at 500 Mt/yr plateau through the late 22nd century and that off-world natural growth compounds at 1.5%/yr—both scenario choices, not inevitabilities. Civilisational priorities, demographic choices, and industrial commitment will set the actual trajectory. None of those can be modelled from physics alone.
Passenger transport at maximum habitat fill rate (2150 upper bound).
If all 22.2 M new residents/yr are actively transported in the same year (the theoretical ceiling, not a forecast), the binding variable is passenger inserted mass ()—the per-person mass of vehicle, life support, consumables, and personal cargo that the launcher must deliver. This is distinct from complexity export (), which covers industrial goods.
| (t/person) | Passenger mass (Mt/yr) | Complexity (Mt/yr) | Total Earth export (Mt/yr) | Lanes @90% uptime |
|---|---|---|---|---|
| 0.2 (minimal ferry) | 4.4 | 7.8 | 12.2 | ~15 |
| 0.5 | 11.1 | 7.8 | 18.9 | ~24 |
| 1.0 | 22.2 | 7.8 | 30.0 | ~38 |
| 2.0 (full shuttle overhead) | 44.4 | 7.8 | 52.2 | ~66 |
At the low end (0.2 t/person: minimal capsule, short transit), passenger migration adds modestly to the industrial stream. At the high end (2.0 t/person: full shuttle with life support, redundancy, and personal cargo), passenger ferry mass dominates and requires 5–7× more lanes than complexity cargo alone. This is the quantitative reason the essay’s “industrial first” timeline is structurally necessary: the habitat shell can scale faster than the passenger pipeline until ferry mass per person falls and/or off-world births dominate net growth.
At 20 megacomplexes, even the heavy case is ~3 tubes per site. The binding constraint at this scale is not launch physics. It is how quickly habitats can be outfitted and made operational to receive people.
Summary.
| Constraint | 2100 | 2120 | 2150 |
|---|---|---|---|
| Lunar housing capacity/yr | 2.22 M | 8.89 M | 22.2 M |
| Earth export (decayed, Mt/yr) | 2.61 | 5.16 | 7.84 |
| Earth launch lanes needed | ~3 | ~6 | ~9 |
| Earth avg power needed | 34–46 GW | 67–91 GW | 103–139 GW |
| Earth solar share (raw intercept) | 0.000020–0.000027% | 0.000039–0.000053% | 0.000060–0.000080% |
| Off-world population | ~16 M | ~132 M | ~780 M |
Key conclusion. The physics is not in the way. The dominant constraints are: (1) lunar industrial throughput setting the housing ceiling, (2) the two-stage decay of Earth’s per-capita complexity burden validating a modest launch-lane requirement, and (3) the bridge vehicle and orbital operations throughput. Energy, on either body, is a large but tractable infrastructure challenge, not a resource limit. By the 22nd century, the bottleneck is whether Earth can export enough irreducible complexity to fill what the Moon and orbital industry can already build. And as orbital industry matures, even that burden contracts.
M. Dry Fraction Sensitivity and Energy Budget Decomposition
The bridge vehicle’s dry fraction is the exponential sensitivity knob on the entire architecture. This appendix decomposes where the energy actually goes and shows why “choose locomotive, not swan” is a structural constraint rather than aesthetic advice.
Where the energy goes. For each kilogram of net payload delivered to LEO via the launcher-assisted hydrolox architecture, the energy budget breaks down into three terms:
- Electric throw (launcher kinetic energy + potential energy): . At = 3 km/s, = 20 km, = 60–70%: ~1.9–2.2 kWh/kg launched. This is a minority share of total energy.
- Propellant synthesis (hydrogen electrolysis): ~57.5 kWh/kg H₂ at DOE-vetted PEM system averages.[29][32] At O/F = 5.5 and the mass ratios below, this dominates.
- Propellant liquefaction (LH₂ + LOX): ~13 kWh/kg LH₂,[30] ~0.2 kWh/kg LOX.
Dry fraction sensitivity table. Assumptions: insertion = 7.3 km/s (including ~400 m/s aerodynamic turn credit); hydrolox = 465 s; launcher = 3 km/s; = 20 km; wall-plug-to-kinetic efficiency assumed 60–70%, tabulated at = 0.70 (at = 0.60 the launcher-energy column rises ~17% and totals by ~3–4%); electrolysis = 57.5 kWh/kg H₂; LH₂ liquefaction = 13 kWh/kg; LOX liquefaction = 0.25 kWh/kg; O/F = 5.5.
| Reusable stage dry fraction | Launched mass per kg payload | Propellant per kg payload | Launcher energy (kWh/kg) | Propellant energy (kWh/kg) | Total (kWh/kg) |
|---|---|---|---|---|---|
| 0.08 (aggressive drone-bus) | 8.22 | 6.56 | ~15.5 | ~71.6 | ~87.1 |
| 0.10 (lean drone-bus) | 9.83 | 7.85 | ~18.5 | ~85.7 | ~104.2 |
| 0.12 (robust drone-bus) | 12.23 | 9.77 | ~23.0 | ~106.7 | ~129.7 |
| 0.15 (human-rated shuttle) | 19.33 | 15.43 | ~36.4 | ~168.5 | ~204.9 |
Two consequences:
There is a dry-fraction cliff. Hydrolox at 7.3 km/s (with aerodynamic turn credit) tolerates reusable dry fractions up to ~20% before the mass ratio diverges, but economics collapse well before that. Moving from 10% to 15% dry roughly doubles total energy per kilogram. This is why “minimal wings, reusable TPS, standard pods, high reuse” is the governing constraint on the architecture.
The electric throw is a minority of total energy. At 10% dry fraction, the launcher contributes ~18.5 kWh/kg while propellant production contributes ~85.7 kWh/kg. The launch system’s power electronics are hard engineering. The planetary energy budget is not.
NTP comparison. For NTP ( = 900 s, hydrogen monopropellant) at 7.3 km/s insertion, mass ratios fall sharply but hydrogen production remains large:
| NTP dry fraction | Launched mass per kg payload | H₂ propellant per kg payload | Total energy (kWh/kg) |
|---|---|---|---|
| 0.10 | 2.68 | 1.50 | ~113 |
| 0.15 | 2.97 | 1.67 | ~125 |
| 0.20 | 3.39 | 1.90 | ~143 |
The NTP table defines dry fraction stage-based (structure ÷ [structure + propellant]), while the hydrolox table above defines it gross-based (structure ÷ total launched mass). The rows are not directly comparable. NTP crushes mass requirements but does not necessarily crush energy requirements, because electrolysis tracks kilograms of hydrogen produced. NASA’s value proposition for NTP is mission mass and trip time, not a cheaper kWh ledger.[7]
N. Environmental Externalities at Scale
The bridge eliminates the worst atmospheric chemistry pathways. It does not eliminate all environmental cost. This appendix catalogues what shifts and what remains.
What the bridge removes. Stratospheric black carbon (soot) from hydrocarbon rockets is the primary concern at scale. NOAA-hosted peer-reviewed work models non-linear climate and ozone impacts under growth scenarios.[3] The launcher-assisted architecture eliminates lower-atmosphere combustion entirely and, when using hydrogen-oxygen upper stages, produces water vapour rather than soot above ~25 km. Montreal Protocol controls have stratospheric ozone on track to recover to pre-1980 levels globally by approximately 2066.[33] The bridge’s constraint is to cause no measurable regression to that trajectory. The environmental comparison in Appendix I quantifies this.
What the bridge introduces or shifts.
Re-entry metal deposition. Direct measurements now show a material fraction of stratospheric aerosol particles containing metals traceable to spacecraft re-entry (“burn-up”).[4] At the launch cadence described in this essay—thousands of returning bridge vehicles per year—re-entry metal aerosol becomes a legitimate atmospheric chemistry monitoring variable. The mitigation path is vehicle design (controlled re-entry corridors, materials selection, ablation management) and quantitative atmospheric monitoring, treated as standard industrial process management.
Orbital debris governance. NASA’s debris mitigation standards and the U.S. Government ODMSP update formalise quantitative limits for large constellations, proximity operations, and disposal reliability.[16] Any “hourly lane” civilisation must treat debris mitigation and traffic management as core infrastructure, not optional compliance. The volume of cis-lunar space is large. The density of useful orbital corridors is not. This is a governance and systems-engineering constraint, not a physics limit.
Land use for generation. At the industrial peak (~8 Mt/yr Earth complexity export), the PV sizing in Appendix O implies hundreds of GW of installed solar nameplate, a major land-use undertaking.[17] Electrolysis is water-intensive. Cryogenic plants are capex-heavy. These are solvable with known engineering but require deliberate siting, permitting, and infrastructure investment on the same centurial timescale as the bridge itself.
NTP governance. Nuclear thermal propulsion adds a regulatory and safety governance layer to any Earth-adjacent operations. NASA’s own materials emphasise NTP as a high-performance in-space option with heritage testing. But the safety case for operations involving fission reactors requires oversight infrastructure commensurate with the technology.[7] The IAEA/UNCOPUOS Safety Framework for Nuclear Power Source Applications in Outer Space provides the international governance baseline for launch approval, operational safety, and end-state disposal.[34]
Net assessment. The bridge does not achieve zero environmental impact. It converts unmanaged atmospheric chemistry (soot injected into the stratosphere by scaling chemical rockets) into managed industrial externalities (land use, water consumption, re-entry aerosol monitoring, debris governance). The latter are tractable engineering and governance problems with historical analogues. The former is not.
O. Earth-Side PV Sizing at Industrial Peak
How much solar generation does Earth actually need to power the bridge at full scale?
Using a baseline of ~116 kWh/kg delivered to LEO (hydrolox, 10% dry fraction) and the essay’s decay-model Earth export schedule:[32]
| Year | Earth export (Mt/yr) | Energy (TWh/yr) | Avg power (GW) | PV nameplate at CF=21.4% (GW) | PV nameplate at CF=34.0% (GW) |
|---|---|---|---|---|---|
| 2100 | 2.61 | ~303 | ~35 | ~162 | ~102 |
| 2120 | 5.16 | ~599 | ~68 | ~319 | ~201 |
| 2150 | 7.84 | ~910 | ~104 | ~485 | ~305 |
Context against solar input. Earth intercepts ~ ≈ 1.74×10¹⁷ W of sunlight continuously.[35][36] The largest figure above (104 GW average at 2150) is ~6×10⁻⁵ % of intercepted sunlight. After grossing up for 25–30% PV conversion efficiency, the 2150 case requires 0.3–0.6 TW of installed solar nameplate—large in human infrastructure terms (“industrial district”), but vanishingly small compared to Earth’s energy budget. For reference, installed global PV capacity crossed 1.6 TW in 2023. The bridge’s peak demand is a modest fraction of where the solar industry is already heading.
NREL ATB 2024 utility-scale PV capacity factors range from 21.4% (resource class 10) to 34.0% (resource class 1), used as bounding cases above.[37]
P. Lunar ISRU Energy Intensity
The Moon’s mass driver is energy-cheap. Processing the regolith is not.
Launch energy from the lunar surface is remarkably small: 0.78 kWh/kg kinetic at escape velocity, ~1.12–1.31 kWh/kg at 60–70% launcher efficiency (Appendix H). But the mass driver launches processed material—metals, glass, oxygen—not raw regolith.
NASA’s ISRU requirements documents note prototype oxygen extraction systems operating at approximately 400 kWh/kg O₂ (annualised, including all system overhead).[38] That is two orders of magnitude larger than the launch energy itself. At 500 Mt/yr of processed export, even if only 20% of the mass requires full extraction-grade processing, the power demand reaches hundreds of GW—still a tiny fraction of the Moon’s ~12.9 PW intercepted sunlight, but the dominant term in the lunar energy budget.
Process innovation—beneficiation, reactor design, thermal recuperation, high-temperature electrolysis—is the difference between “lunar industry” and “lunar science outpost.” NASA’s regolith electrolysis efforts (e.g., the GaLORE programme at Kennedy Space Center) confirm the core chemistry is known. The efficiency frontier is still open.[39]
| Lunar process | Energy intensity | Notes |
|---|---|---|
| Mass driver launch | ~1.1 kWh/kg | Kinetic + efficiency losses; the easy part |
| Oxygen extraction (prototype) | ~400 kWh/kg O₂ | NASA ISRU annualised; target is orders of magnitude lower |
| Metal smelting (analogous) | ~15–25 kWh/kg | Terrestrial aluminium smelting analogue |
| Total processing (speculative mature) | ~30–100 kWh/kg | High uncertainty; depends on beneficiation breakthroughs |
Launch energy is negligible. Processing energy is the industrial constraint that determines whether the Moon is a quarry or merely a laboratory.
Q. Why Ground SSTO Fails and Bridge SSTO Works
The launcher is the first stage—made of bedrock and electricity instead of aluminium and kerosene, used thousands of times, never discarded.
The single-stage-to-orbit spaceplane has been pursued since the 1960s (X-20 Dyna-Soar, X-33/VentureStar, Skylon). It has never closed. The mass budget explains why—and why the Bridge changes the arithmetic.
The SSTO mass budget. For a reusable vehicle with dry fraction (structure as a fraction of gross liftoff mass), the payload fraction is:
where is the mass ratio. If , the vehicle cannot reach orbit with any useful cargo.
| Scenario | Payload at 8% dry | Payload at 10% dry | Payload at 12% dry | |||||
|---|---|---|---|---|---|---|---|---|
| Ground SSTO, kerolox avg | 9.2 km/s | 330 s | 3.24 km/s | 17.1 | 5.8% | −2.2% | −4.2% | −6.2% |
| Ground SSTO, hydrolox avg | 9.2 km/s | 420 s | 4.12 km/s | 9.3 | 10.7% | 2.7% | 0.7% | −1.3% |
| Bridge cargo, vacuum hydrolox | 7.2 km/s | 465 s | 4.56 km/s | 4.85 | 20.6% | 12.6% | 10.6% | 8.6% |
| Bridge human, vacuum hydrolox | 7.8 km/s | 465 s | 4.56 km/s | 5.53 | 18.1% | 10.1% | 8.1% | 6.1% |
Ground kerolox SSTO is impossible. At any realistic dry fraction, payload is negative. The exponential wins.
Ground hydrolox SSTO is marginal. At an aggressive 8% dry fraction—lighter than any crewed reusable vehicle ever built—payload is 2.7%. A 100 t vehicle delivers 2.7 t. And this uses a trajectory-averaged 420 s Isp because the engine must fire through dense atmosphere with a compromised nozzle. It never achieves full vacuum performance. NASA cancelled the X-33 programme because the composite hydrogen tanks required to reach this dry fraction could not be manufactured to spec.
Bridge-assisted SSTO is comfortable. At 10% dry fraction—a realistic reusable lifting body—cargo payload is 10.6% and human payload is 8.1%. A 485 t vehicle delivers 50 t of cargo. The margin is wide enough for engineering growth, structural reserves, and operational reality.
Three effects compound. The Bridge changes the SSTO problem categorically:
-
Δv reduction (9.2 → 7.2 km/s): the electromagnetic climb and aero turn remove 2.0 km/s of engine duty. Through the exponential, this alone cuts the mass ratio from 9.3 to 4.85 (at hydrolox Isp).
-
Isp upgrade (420 → 465 s): the vehicle fires a pure vacuum nozzle from ignition. No sea-level compromise, no trajectory-averaged Isp penalty. The 11% Isp gain hits the exponent’s denominator.
-
Structural relief: no Max Q at full propellant load, no transonic drag shaping, no sea-level engine mass. The lifting body is shaped by landing and the aero turn—requirements it needs anyway. Every structural kilogram that a ground SSTO spends fighting the atmosphere, the Bridge vehicle spends on payload margin.
The combined effect: the exponent drops from (ground kerolox) to (Bridge hydrolox). A 44% reduction in the exponent produces a 72% reduction in mass ratio (17.1 → 4.85). The SSTO that was always 2% short has 10% margin.
Why previous assisted launch didn’t solve this. Air launch (Virgin Orbit, Pegasus) provides ~250 m/s at ~10 km. The rocket still does 97% of the work, still fires through dense atmosphere, still uses a sea-level engine. The assist is too small to shift the propulsion regime. The Isp stays the same, the losses stay the same, and the mass budget barely moves.
SpinLaunch and sea-level railguns provide more speed but at sea level, where dynamic pressure destroys the vehicle before it can bank or burn. These systems add velocity at the wrong altitude. The Bridge adds altitude at moderate velocity, which changes the engine, the propellant, the nozzle, and the structural envelope simultaneously. That is why the savings compound exponentially rather than adding linearly.
The deeper point. The SSTO spaceplane starts in the wrong place. Move the starting line from sea level to 20 km for vacuum engines, and the mass budget that was always negative becomes robustly positive.
R. The Falsifier Register
A bridge you cannot falsify is a painting of a bridge.
Recorded July 2026. The essay is a centurial project, so the register separates what can fail by a date, what can fail only by recomputation, and what is declared as modelling.
R.1 — The necessity claim, by 2035. §I rests on published modelling that ozone and climate damage from chemical launch rise non-linearly at roughly ten times today’s cadence, while moving civilisation off-Earth needs hundreds of times (Appendix I, Appendix N). Launch cadence is public and stratospheric monitoring is continuous. If cadence grows by an order of magnitude by 2035 and measurement shows no regression against the Montreal recovery trajectory, the ceiling sits higher than modelled and the bridge’s necessity argument weakens to an economics argument. The bridge would still be the railroad. The horse would be healthier than claimed.
R.2 — The rocket floor, both directions, by 2040. The essay puts reusable rockets at $50–200/kg and hands them the bootstrap: they seed the lunar industry that justifies Meridian. The claim can fail both ways, so the register watches both. If sustained commercial pricing has not reached ~$200/kg by 2040, the bootstrap stalls and the cathedral chain slips a phase. If pricing instead falls well below $50/kg while cadence scales without R.1’s limit binding, Meridian’s window narrows to the bulk-throughput regime no rocket fleet reaches—the 400–1,000× of §I and Appendix G—and the bridge becomes a later, larger project than the essay implies.
R.3 — The materials gate, by 2045. Appendix F names the pylon the weakest link. Macro-scale CNT fibres run 4–7 GPa today, with 14 GPa demonstrated, and the tension-stabilised mast is a known structural type. The gap is production. If commercial-volume CNT fibre has not passed ~10 GPa by 2045, the 20 km terminal recedes a generation and the architecture falls back to what Appendix F2 already prices: angled exits at 8 km serving ruggedised bulk cargo, where most early tonnage lives anyway. The timetable dies. The physics does not.
R.4 — The arithmetic, checkable today. Some claims wait on no event; they fail by recomputation. The atmosphere tax: 9.2 km/s from the ground against 7.8 km/s in orbit (Appendix B). The 95% line: that share of atmospheric mass below 25 km (Appendix A). And the Pythagorean Dividend carries two design points that must not be conflated: the crewed vehicle exits at 700 m/s and banks for ~100 m/s of horizontal gain at a 7 m/s vertical tax—one per cent—while the 3 km/s cargo shot gains 500 m/s at a 42 m/s tax—1.4 per cent (Appendix C2). The body quotes the crewed case, because that is the flight the reader takes. A reader with a spreadsheet can attack every number in this entry this afternoon. That is the point.
R.5 — Declared modelling, no honest date. The lunar arithmetic is modelling on published constants, not measurement: $0.04/kg is launch energy at lunar solar prices (Appendix J), and the honest dominant term is processing—prototype oxygen extraction runs near 400 kWh/kg, two orders of magnitude above launch energy (Appendix P). If ISRU processing energy does not fall by at least an order of magnitude from the prototype figure, the Moon stays a laboratory, §V’s asymmetry weakens, and the habitats of §VI wait on Earth exports the launcher alone cannot supply. No date is honest here. The number to watch is NASA-published ISRU energy intensity, and the register names it so the claim cannot drift into folklore.
Declared interest, July 2026. The author holds no commercial stake in this architecture. He intends to build an Age of Wonders infrastructure group making access bets across the sectors this canon names. The register exists so that intention can never quietly grade its own homework.
References
Numbered in order of first citation.
[1] Sutton, G.P. & Biblarz, O. (2017). Rocket Propulsion Elements (9th ed.). Wiley. Representative launch-to-orbit velocity budgets and loss breakdowns.
[2] Tsiolkovsky, K.E. (1903). “Exploration of Outer Space by Means of Rocket Devices.” Nauchnoye Obozreniye. The exponential mass-ratio relation .
[3] Ross, M.N. & Shearer, D. (2022). “Radiative Forcing Caused by Rocket Engine Emissions.” Earth’s Future 10(6). NOAA-affiliated analysis of stratospheric ozone and climate impacts from scaled launch activity.
[4] Murphy, D.M. et al. (2023). “Metals from spacecraft reentry in stratospheric aerosol particles.” Proceedings of the National Academy of Sciences 120(43), e2313374120. Direct measurement of spacecraft-origin metals in stratospheric aerosol; ~10% of sampled particles carried aerospace alloy signatures.
[5] Sierra Space. “Dream Chaser.” Reusable lifting-body orbital vehicle; runway landing at 1.5 g; designed for 15+ missions per system.
[6] ArianeGroup. “Vinci Engine.” Restartable cryogenic upper-stage engine, vacuum = 465 s, thrust 180 kN.
[7] NASA Technical Reports Server. Houts, M.G., Mitchell, D.P. & Kim, T. (2015). “Guidance, Navigation, and Control Considerations for Nuclear Thermal Propulsion.” First-generation NTP systems can provide high thrust at specific impulse above / on the order of 900 s using hydrogen propellant heated by a fission reactor.
[8] BryceTech (2025). State of the Satellite Industry Report. Total spacecraft upmass to orbit in 2024: approximately 2,171 tonnes across all global launches.
[9] NASA Science. “Moon Facts.” See also JPL Solar System Dynamics: “Planetary Satellite Physical Parameters.” Lunar surface gravity ≈ 1.62 m/s²; lunar escape velocity ≈ 2.38 km/s.
[10] National Commission on Space (1986). Pioneering the Space Frontier. Report to the President. Bantam Books. Lunar-to-high-Earth-orbit energy cost estimated at less than 1/20th of Earth-to-HEO for equivalent mass.
[11] Lunar mass driver energy cost is original modelling: kinetic energy at lunar escape velocity 2.38 km/s (NASA NSSDCA), 60–70% launcher efficiency, IEA/EIA industrial power price ranges. Polar solar illumination data: Noda, H. et al. (2008). “Illumination Conditions at the Lunar Polar Regions by KAGUYA (SELENE) Laser Altimeter.” Geophysical Research Letters 35(24).
[12] Heiken, G.H., Vaniman, D.T. & French, B.M. (1991). Lunar Sourcebook: A User’s Guide to the Moon. Cambridge University Press. Comprehensive regolith composition data from Apollo and Luna samples.
[13] Lester, D.F. & Thronson, H. (2011). “Human Space Exploration and Human Spaceflight: Latency and the Cognitive Scale of the Universe.” Space Policy 27(2), 89–93. Teleoperation viability as a function of communication latency; Earth-Moon round-trip latency ~2.6 s.
[14] Crawford, I.A. (2015). “Lunar Resources: A Review.” Progress in Physical Geography 39(2), 137–167. Overview of cis-lunar economic geography and resource accessibility.
[15] Ross, M.N. et al. (2009). “Limits on the Space Launch Market Related to Stratospheric Ozone Depletion.” Astropolitics 7(1), 50–82. Early quantitative framing of launch-rate ceilings from atmospheric chemistry.
[16] U.S. Government (2019). U.S. Government Orbital Debris Mitigation Standard Practices (ODMSP), November 2019 Update. See also NASA-STD-8719.14, Process for Limiting Orbital Debris.
[17] Ong, S. et al. (2013). “A Comparison of Ground-Mounted and Rooftop-Mounted Utility-Scale Solar Photovoltaic (PV) System Impacts.” NREL/TP-6A20-56290. Empirical land-use benchmarks for utility-scale solar.
[18] NOAA/NASA/USAF (1976). U.S. Standard Atmosphere, 1976. Atmospheric density, pressure, and temperature as functions of altitude.
[19] L3Harris Technologies. “RL10 Engine.” RL10C-X vacuum = 460.9 s; O/F ≈ 5.5.
[20] NASA (2024). NASA Space Flight Human-System Standard Volume 2: Human Factors, Habitability, and Environmental Health. NASA-STD-3001, Rev. C. Sustained translational acceleration limits and human-system integration requirements for crewed spacecraft.
[21] Peng, B. et al. (2008). “Measurements of Near-Ultimate Strength for Multiwalled Carbon Nanotubes and Irradiation-Induced Crosslinking Improvements.” Nature Nanotechnology 3, 626–631. See also Bai, Y. et al. (2018), “Carbon nanotube bundles with tensile strength over 80 GPa,” Nature Nanotechnology 13, 589–595; Wang, S. et al. (2024), “Dynamic strength of carbon nanotube fibres exceeding 14 GPa,” Science 383, 185–190.
[22] McNab, I.R. (2003). “Launch to Space with an Electromagnetic Railgun.” IEEE Transactions on Magnetics 39(1), 295–304. Pulsed-power requirements for electromagnetic launch to orbit. See also Powell, J. et al. (2010). “StarTram: A New Approach for Low-Cost Earth-to-Orbit Transport.” AIAA Space Conference. Gen-1 reference: ~110 km evacuated tunnel, ~8 km/s exit, ~35 t payloads, projected $43/kg.
[23] NASA Technical Reports Server. “Magnetic Launch Assist.” See also: “Magnetic Launch Assist.” NASA studies on electromagnetic launch-assist concepts for reducing vehicle propellant and increasing payload fraction.
[24] General Atomics. “EMALS & AAG.” Electromagnetic Aircraft Launch System: linear induction motor, adjustable thrust, smooth controlled acceleration, rapid recharge, and operational deployment on Ford-class aircraft carriers. Validates the industrial architecture class: pulsed power → power electronics → linear motor → controlled acceleration of reusable vehicles.
[25] International Energy Agency. World Energy Outlook. Global electricity production ~ J/year.
[26] O’Neill, G.K. (1977). The High Frontier: Human Colonies in Space. William Morrow. Lunar mass drivers for export of processed materials to L5 construction sites.
[27] Sharma, S.P. et al. (2024). NASA Technical Memorandum. “Impact of Spaceflight on Earth’s Atmosphere.” Review of launch and re-entry particulate emissions, including comparison of future launch/re-entry emissions to meteoritic background flux.
[28] Bussey, D.B.J. et al. (2010). “Illumination Conditions of the South Pole of the Moon Derived Using Kaguya Topography.” Icarus 208(2), 558–564. South polar crater rims receive illumination for 70–90% of the lunar year.
[29] U.S. Department of Energy (2024). “PEM Electrolysis for Hydrogen Production.” DOE Hydrogen Program. Average system electricity consumption ~55–58 kWh/kg H₂.
[30] U.S. Department of Energy. “Energy Requirements for Hydrogen Gas Compression and Liquefaction.” DOE Hydrogen Program Record 9013. Liquefaction typically 10–13 kWh/kg LH₂; theoretical minimum 3.3–3.9 kWh/kg.
[31] United Nations, Department of Economic and Social Affairs, Population Division (2022). World Population Prospects 2022. Medium variant: global population peaks in the 2080s at roughly 10.4 billion, then declines.
[32] U.S. Department of Energy (2024). “Clean Hydrogen Production Cost—PEM Electrolyzer.” DOE Hydrogen Program Record 24005. Beginning-of-life system electricity ~55.2 kWh/kg H₂; lifetime average ~57.5 kWh/kg H₂.
[33] WMO/UNEP (2022). Scientific Assessment of Ozone Depletion: 2022. WMO Global Ozone Research and Monitoring Project, Report No. 58. Full recovery of stratospheric ozone to 1980 levels projected globally by approximately 2066.
[34] IAEA/UNCOPUOS (2009). Safety Framework for Nuclear Power Source Applications in Outer Space. International governance baseline for nuclear systems in space, including NTP launch approval and disposal.
[35] NASA Goddard Space Flight Center. “Solar Irradiance.” Total solar irradiance ≈ 1361 W/m²; global average incident solar input ≈ 340 W/m².
[36] NASA Earth Observatory. “Climate and Earth’s Energy Budget.” Absorbed solar ~240 W/m² global average; reflected ~100 W/m².
[37] NREL (2024). Annual Technology Baseline—Utility-Scale PV. Capacity factor resource classes: 21.4% (class 10) to 34.0% (class 1).
[38] Larson, W.E. et al. (2019). “ISRU Experiment Requirements and Concepts for Lunar and Mars Exploration.” NASA/KSC. Prototype oxygen extraction: ~400 kWh/kg O₂ (annualised system energy).
[39] NASA Kennedy Space Center. “NASA Kennedy Breathes Life into Moon Soil Testing.” Technology development for molten regolith electrolysis and oxygen extraction from simulated lunar regolith. See also: Kleinhenz, J.E. et al. (2021). “GaLORE: Gaseous Lunar Oxygen from Regolith Electrolysis.”
[40] NASA Technical Reports Server. Herman, D.A. et al. (2022). “Development and Qualification Status of the Electric Propulsion Systems for the NASA PPE Mission and Gateway Program.” (Background reference, uncited.) NASA Gateway Power and Propulsion Element: 50 kW-class solar electric propulsion spacecraft for cis-lunar logistics.
Background References
Landis, G.A. (2005). “Reactionless Orbital Propulsion Using Tether Deployment.” AIAA/ASME/SAE/ASEE Joint Propulsion Conference. NASA Glenn Research Center. High-altitude launch analysis.
Lofstrom, K. (1985). “The Launch Loop: A Low Cost Earth-to-High Orbit Launch System.” AIAA Space Programs and Technologies Conference. Active dynamic structure for launch assist.
Birch, P. (1982). “Orbital Ring Systems and Jacob’s Ladders.” Journal of the British Interplanetary Society 35. Orbital ring concept for Earth-to-space transport at high throughput.
National Research Council (2012). NASA Space Technology Roadmaps and Priorities. The National Academies Press. https://doi.org/10.17226/13354
Smil, V. (2017). Energy and Civilization: A History. MIT Press.
NASA In-Situ Resource Utilisation (ISRU) Strategy. https://www.nasa.gov/isru
Jenett, B. et al. (2020). “Digital Morphing Wing: Active Wing Shaping Concept Using Composite Lattice-Based Cellular Structures.” Soft Robotics 4(1). Architected lattice materials for ultra-light aerospace structures.